ZLBT Chats

Monday, August 31, 2009

Firmer CPO futures mart expected

Crude palm oil (CPO) futures on Bursa Malaysia Derivatives are expected to be firmer next week with the market anticipating the release of positive export figures, dealers said.

They said export figures from the two cargo surveyors, Societe Generale de Surveilance (SGS) and Intertek Testing Services (ITS), would be released next week.

"The prices will move in line with the prospect of good export figures," a dealer said.

The dealer also said the price would be pressured by the steady soyoil prices on the Chicago Board of Trade (CBOT) amid a continued buying mood.
"Market sentiment will be supported by higher demand ahead of the festive season especially from Muslim-majority countries," dealer added.
An analyst said the market is expected to see a strong support level of RM2,300 per tonne and a resistance level of RM2,400.
During the week, the Malaysian market was volatile, tracking the soyoil futures on the CBOT, as both are competing for the same export destinations.

November 2009 and December 2009 were the most active contracts throughout the week.

On a Friday-to-Friday basis, spot month September 2009 was up RM60 to RM2,440 per tonne, October 2009 added RM3 to RM2,381 per tonne, November 2009 increased RM25 to RM2,370 per tonne and December 2009 rose RM25 to RM2,360. The week's turnover stood at 76,153 lots, down from last week''s 117,199 lots, while the open position dropped to 84,990 contracts on Friday from 85,985 at the end of last week.

On the physical market, April South was traded higher at RM2,460 per tonne on Friday compared to RM2,400 per tonne, previously

Saturday, August 29, 2009

FBM KLCI Futures To Remain Rangebound Next Week

The FTSE Bursa Malaysia Kuala Lumpur Composite Index (FBM KLCI) futures contract on Bursa Malaysia Derivatives is expected to remain rangebound next week in line with the underlying cash market.
A dealer said the futures market would remain lacklustre, especially with the results season over and unless new leads show up to stir it.On a week-to-week basis, spot month August 2009 rose 18.0 points to settle at 1,177.5 from last Friday while September 2009 gained 11.5 points to 1,169.0.
December 2009 and March 2010 each increased 11.0 points to 1,164.0 and 1,158.0 respectively.

The week's turnover increased to 56,302 lots from 35,999 lots last week while open interests stood at 21,592 contracts against 20,081 previously.

BURSA MALAYSIA >>> Consolidation in rangebound trade

With the lack of fresh market leads, overall Malaysian market sentiment is likely to drift aimlessly in a directionless market.

SHARE prices on Bursa Malaysia continued to consolidate in rangebound trading throughout the five trading days of the week. The FTSE Bursa Malaysia Composite Index (FBM KLCI) continued to stay above its critical support of 1,100 points when it closed at 1,174.27 yesterday.

The FBM KLCI opened higher at 1,168.96 before rebounding to close at its intra-day high of 1,174.49 on Monday, giving a day-on-day gain of 10.70 points, or 0.92 per cent.

Overall market sentiment moved counter-trend to the regional stock markets on Tuesday. The FBM KLCI fell from its intra-day high of 1,174.58 before slipping to its intra-day low of 1,168.99 that day. It closed at 1,171.09, giving a day-on-day loss of 3.40 points, or 0.29 per cent.

The FBM KLCI moved sideways in step with the performances on the regional stock markets on Wednesday. The benchmark index closed at 1,172.56, giving a day-on-day gain of 1.47 points, or 0.13 per cent.

Once again, share prices on Bursa Malaysia moved counter-trend to the performances on the regional stock markets on Thursday. The FBM KLCI closed at 1,176.90, giving a day-on-day gain of 4.34 points, or 0.37 per cent.

Share prices on Bursa Malaysia paused for sideways consolidations yesterday. The FBM KLCI closed at 1,174.27, giving a day-on-day loss of 2.63 point, or 0.22 per cent.

The FBM KLCI posted a week-on-week gain of 10.48 points, or 0.90 per cent.

Among other indices, the FTSE Bursa Malaysia Small Cap Index eased 34.19 points, or 0.35 per cent, to 9,812.20 while the FTSE Bursa Malaysia ACE Index lost 60.31 points, or 1.43 per cent, to 4,145.53.

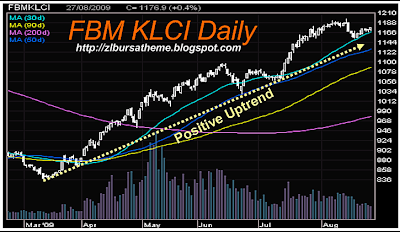
The following are the readings of some of the FBM KLCI's technical indicators:

Moving Averages: The FBM KLCI continued to stay above its 10-, 20-, 30-, 50-, 100- and 200-day moving averages.
Momentum Index: Its short-term momentum index continued to stay below the support of its neutral reference line.
On Balance Volume (OBV): Its short-term OBV trend continued to stay below the support of its 10-day exponential moving averages.
Relative Strength Index (RSI): Its 14-day RSI stood at the 58.77 per cent level yesterday.

Outlook
Continuing mild technical rebounds sent the FBM KLCI to its intra-day high of 1,178.77 yesterday, moving within the confines of this column's envisaged support zone (1,167 to 1,200 levels).

The FBM KLCI's weekly chart continued to stay above its immediate downside support (See FBM KLCI's weekly chart A5:A6) yesterday. It continued to stay above its resistance-turned-support trendline (A3:A4).

Chartwise, the FBM KLCI's daily trend continued to stay above its downside support (See FBM KLCI's daily chart B1:B2) yesterday. It continued to stay below its intermediate-term uptrend (B5:B6).

The FBM KLCI's weekly and monthly fast Moving Average Convergence Divergence (MACD) indicators stayed above their respective slow MACDs yesterday. Its daily fast MACD stayed below its daily slow MACD.

The FBM KLCI's 14-day RSI stayed at 58.77 per cent level yesterday. Its 14-week and 14-month RSI stayed at 71.03 and 57.64 per cent levels respectively.

Last week, we commented that the FBM KLCI would move into rangebound trading over next the five trading days. It did. The FBM KLCI's weekly trading range shrank to 11 points.

With the lack of fresh market leads, overall market sentiment is likely to drift aimlessly in a directionless market. Heavy-weight index-linked counters will continue to play pivotal roles in maintaining the market momentum.

Next week, the FBM KLCI's envisaged resistance zone hovers at the 1,178 to 1,212 levels while its immediate downside support is at the 1,136 to 1,170 levels.

Dow’s Win Streak Dies Despite Intel, Data

The bulls’ effort to send the Dow to its longest winning streak since 1996 came up short on Friday despite a better-than-expected consumer sentiment report.

The benchmark index still held onto a second consecutive week of gains, however, and the Nasdaq Composite inched higher thanks to Intel’s bullish guidance.

Today's Markets

The Dow Jones Industrial Average fell 36.43 points, or 0.38%, to 9544.20, the Standard & Poor's 500 lost 2.05 points, or 0.20%, to 1028.93 and the Nasdaq Composite picked up 0.05 points, or 1.04%, to 2028.77.

While the Dow's run came to an end on Friday, the index gave back just a fraction of its 445-point gain over that span. The bears and even some bulls have been calling for a correction, fearing stocks have gotten too far ahead of the slowly-recovering economy. But a sizable correction has yet to materialize during the Dow's 3,000 point surge since March 9.

The modest selloff prevented the Dow from notching its first nine-day winning streak since Nov. 1996. Still, the benchmark index climbed higher for the second week in a row remains on track for its best August since 2000.

“We are certainly due for a retracement,” said NSYE trader Jason Weisberg of Seaport Securities. “But down 50, 75, or even 100 points is not a retracement that people are looking for. That tells me the bears aren’t going to have their way this week and probably won’t have it next week either.”

Friday, August 28, 2009

TECHNICAL ANALYSIS >>> Composite Index 28/08/2009 / 综合指数 2009年 8月 28日

Composite Index 28/08/2009
As shown in the chart above, the Bollinger Bands contracted 11%; therefore, the KLCI end 2.63 pt lower to close at 1174.27 pt. Anyway, the KLCI is still supported by the Bollinger Middle Band and the 14, 21, 31 days Exponential Moving Average (EMA) (refer to A), hence, the KLCI has no sign of turning weak, while remains at its sideways consolidation.

Though the KLCI break above the Bollinger Middle Band, the Bollinger Bands is still narrowing; therefore, until the Bollinger Bands begins to expand, the KLCI is not able to start a new up trend. The
KLCI support level falls at 1163 pt Fibonacci Retracement (FR), while the resistance remains at 1186 pt FR.

As indicated by B, volume traded upped 8.1%, but it is still lower than the 40 days Volume Moving Average (VMA), this suggests that the overall market remains quiet, and this is also a normal situation during a sideways KLCI.

The Stochastic is gradually moving higher (As circled by C), suggesting the KLCI is picking up some strength; however, this signal is insignificant when the Bollinger Bands is narrowed; this is because all Secondary Indicators are not meant to work alone, and it must be combined with the Primary Indicators like Chart Patterns, Bollinger Bands, EMA etc.

Basically, the KLCI has not changed much for the whole week, and it is still consolidating. Technically, when the Bollinger Bands is narrowing, it indicates that the KLCI is preparing for a new trend, but the new will only be confirmed when the Bollinger Bands begins to expand. Therefore, should the KLCI maintaining above the Bollinger Middle Band, there is a chance of the KLCI in forming an up trend.
综合指数 2009年 8月 28日
]如图所示,由于布林频带(Bollinger Bands)进一步收窄11%,所以富时综合指数下滑2.63点,以1174.27点闭市。无论如何,综指目前依然获得布林中频带(Bollinger Middle Band)以及14、21、31天加权移动平均线(EMA)的扶持(参考箭头A),所以综指并未转为跌势,综指目前只继续横摆巩固。

如图所示,虽然综指已经上扬突破了布林中频带,惟布林频带仍然收窄,所以综指还未确认上扬的趋势,直到布林频带开始打开为止。

综指当前的支持水平依然落在1163点的费氏线,阻力水平则是1186点的费氏线。
如图中箭头B所示,马股成交量上扬8.1%,不过还是处于40天成交量移动平均线(VMA)以下,所以综指还是未摆脱淡静的格局,这也是成交量在综指横摆巩固的一种普遍现象。

随机指标(Stochastic)继续缓缓上扬(参考C圈),这显示综指仍然有转强的迹象,只是在布林频带收窄的时候,此上扬的讯号并不显著,因为任何次要指标(Secondary Indicator)都必须配合只要指标(Primary Indicator)如图形、布林频带、

移动平均线等等,才能发出有效的讯号。
总的来说,综指的走势基本上都未有太大的变化,继续处于一个横摆巩固的格局。从布林频带的收窄的技术角度来看,综指目前正酝酿着一个新的走势,不过此新走势只在布林频带再度打开时才能确认,所以只要综指能一直维持在布林中频带以上,综指转强的几率将有望提高。

Intra-day Positives

The US Dow Jones shrugged off the intra-day bears to move higher yesterday. More importantly, our local FBM-KLCI managed to squeak out a white candle by market closing, which reaffirms our positive views on the market. Intra-Day Bulls : An affirmation of our positive views
The intra-day bulls were busy at work yesterday, brushing aside the bears to pave the way upwards for the US Dow Jones and our local FBM-KLCI.

Last night, the bears were having the upper hand in the US markets. However, the bulls recovered to push the Dow into positive territory by market closing. As a result, a positive hammer candlestick pattern was formed in the charts, thereby reaffirming our positive views on the US market.
Similarly on the local front, the KLCI bulls also succeeded in shrugging off the bears during intra-day trading. As a result, our KLCI closed with a positive candle yesterday which denotes more bullishness ahead.
Strategy :
We reaffirm our short term, mid term and long term positive view on the FBM-KLCI.

TECHNICAL ANALYSIS >>> 综合指数 2009年 8月 27日 / Composite Index 27/08/2009

综合指数 2009年 8月 27日
富时综合指数再度收高,以1176.9点闭市,成功守住14、21、31天加权移动平均线(EMA)的水平(参考箭头A)。目前14、21、31天的EMA仍然是综指中长期的支持线,所以只要综指继续维持在此EMA以上,综指的中长期走势将能继续维持在上扬的格局。

综指终于成功上扬突破了布林中频带(Bollinger Middle Band),所以综指当前的支持水平除了EMA外,就是布林中频带,综指的另一道支持水平落在1163点的费氏线,阻力水平则仍然是1186点的费氏线。

如图中箭头B所示,虽然综指上扬,不过马股成交量却进一步减少8%,依然低于40天成交量移动平均线(VMA),这是市场维持淡静的讯号,所以综指目前仍然属于调整巩固中。

随机指标(Stochastic)上扬突破50%的水平(参考C圈),这是综指短期走势转强的迹象,无论如何,由于布林频带(Bollinger Bands)目前处于收窄的情形,所以随机指标得上扬突破70%,综指才能确认出现短期上扬的趋势。

整体上综指缓缓的从跌势中回弹,终于上扬突破了布林中频带,这显示综指有止跌的迹象,惟布林频带目前还是收窄中,所以综指止跌的讯号并未获得确认,直到布林频带再度打开为止。另一方面,14、21、31天的EMA这是综指当前重要的支持线,因为若综指跌破EMA的话,综指的中长期也会开始转弱。
Composite Index 27/08/2009
The KLCI gained 4.34 pt to close at 1176.9 pt, as the result of that, the KLCI successfully stands above the 14, 21, 31 days Exponential Moving Average (EMA) as indicated by arrow A. Currently the 14, 21, 31 days EMA remain as the mid and long term support level of the KLCI, and therefore, the KLCI will be able to maintain in a mid and long term up trend, as long as the KLCI is able to hold above these EMA.

Besides the EMA, the Bollinger Middle Band (BMB) had become the Dynamic Support of the KLCI, after the KLCI successfully break above the Bollinger Middle Band. The KLCI is also supported by the 1163 pt Fibonacci Retracement (FR), while the resistance remain at 1186 pt FR.

As indicated by arrow B, despite the KLCI advanced another 0.4%, volume traded declined 8%, while still below the 40 days Volume Moving Average (40-day VMA level); this shows the overall market is still quiet, and the KLCI remain in a consolidation state.

As circled at C, the Stochastic broke above 50% today, and this is the sign the KLCI short term trend is turning upwards; however, since the Bollinger Bands is remains contracted, the Stochastic need to break above 70%, in order to confirm this short term up trend signal.

All in all, the KLCI is slowly recovering from the downtrend as it finally break above the Bollinger Middle Band; this indicates that the KLCI short term downtrend may come into an end. However, the narrowing Bollinger Bands suggests that this signal has yet to be confirmed, until the Bollinger Bands begins to expand again. On the other hand, the 14, 21, 31 days EMA are important support level of the KLCI, and should the KLCI fall below these EMA, the KLCI mid and long term trend would form a downtrend.
HAPPY TRADING FOLKS & GOODLUCK2ALL!!!

Dow Makes It 8 >>> Longest Win Streak Since '07

The markets stayed hot on Thursday as an afternoon comeback landed the Dow more than 3,000 points above its March low and in the green for the eighth consecutive day, something that hasn't happened in more than two years. U.S. equities rebounded on Thursday, lifted by financial stocks, while crude oil bounced off two days of declines on the turn in Wall Street sentiment.

The upbeat turn in financial markets overshadowed a growing sense among investors that recent asset price gains and optimism about a world recovery have been overdone.

"There's a floor in this market and it's probably at least 5% below the recent highs and there's still so much cash on the sidelines that when we see a selloff, there are retail investors and institutional investors ready to jump back in." said a Wall Street dealer.

The Dow Jones Industrial Average rose 37.11 points, or 0.39%, to 9580.63, the Standard & Poor's 500 gained 2.86 points, or 0.28%, to 1030.98 and the Nasdaq Composite added 3.30 points, or 0.16%, to 2027.73.
The Dow’s win streak appeared to be nearing an end as the bears pushed stocks sharply lower Thursday morning amid a 2% dive for crude oil. The losses were only temporary as oil and the markets soared back into the green.
The up-and-down trading day comes amid a particularly calm stretch for Wall Street as the markets barely reacted to new reports on jobless claims and gross domestic product. Underscoring the relative calm, the S&P 500 narrowly avoided closing with a change of 0.25% or less for the fourth day in a row, something that Miller Tabak's Dan Greenhaus said hasn't happened since February 2007.
Thanks to a flurry of economic optimism, the Dow has now surged more than 3,000 points since hitting a 12-year low on March 9. But even some bulls question whether or not the markets have gotten ahead of an economy still facing heavy job losses and a weak housing market.

Today’s headlines are mostly positive, “but I am itching to sell here. I have reached most of my targets and am ready to pull the trigger,” Peter Kenny, managing director at Knight Capital Markets, wrote in a note before the market opened. “We are getting a correction 5%-10% within the month…You have to take some chips off the table due to the nature of the season we are in.”

Crude Oil Stays Above $72
Crude oil was at the center of Thursday's back-and-forth action as the commodity plunged below $70 a barrel before making a comeback, taking some of the pressure off energy stocks like Massey Energy and Consul Energy. Crude settled at $72.49 a barrel, down $1.06, or 1.48%.

Thursday, August 27, 2009

BURSA MALAYSIA: Share Prices End Firmer On Buying Of Key Heavyweights

SHARE prices on Bursa Malaysia ended the day firmer with buying interest in key heavyweights, especially in the plantation and banking sectors, dealers said. However, the gains were limited by losses in other selected counters such as Tenaga Nasional, they added.

The FTSE Bursa Malaysia Kuala Lumpur Composite Index (FBM KLCI) ended 4.34 points higher or 0.37 per cent better at 1,176.9, after opening 0.02 per cent higher at 1,172.58 in the morning. According to an analyst, the market would remain rangebound until the results season is over.
Another dealer said the local market was tracking not only the US market but also the volatile Chinese market, which has a big impact on regional bourses.
He added that the better than expected second quarter gross domestic product (GDP) result for the country also did not boost the market much, as investors have already factored in contributions from the various sectors such as construction and services.

At 5pm, the Finance Index was up 40.1 points at 9,536.09, the Plantation Index advanced 7.77 points to 5,834.3 and the Industrial Index increased 14.04 points to 2,597.76.
The FBM Emas Index gained 17.24 points to 7,937.44, the FBM Top 100 went up 20.79 points to 7,719.57 but the FBM ACE Index dropped 10.42 points to end at 4,162.15.

However, losers still led gainers 363 to 292 while 241 counters closed unchanged with 354 untraded and none suspended.

Turnover also fell to 585.087 million shares worth RM1.009 billion from the 636.267 million shares worth RM930.776 million yesterday.


Of the volume leaders, Timecom gained three sen to 41.5 sen while Winsun and Gamuda went down one sen to 8.5 sen and 10 sen respectively. MSports fell 4.5 sen to 61 sen and Time increased half a sen to 28 sen.
The top gainers included British American Tobacco which jumped 90 sen to RM45.90 while DiGi advanced 28 sen to RM22.00 and DKSH increased 21 sen to 69.5 sen. The top losers included Tomei which declined 25.5 sen to 54.5 sen, Dlady which dropped 24 sen to RM11.50 and Nestle which lost 20 sen to RM33.80.
Among the heavyweights, Sime Darby rose one sen to RM8.24 while Tenaga Nasional shed ten sen to RM8.00. Maybank and Public Bank gained four sen to RM6.51 and RM9.93 respectively while Bumiputera-Commerce and PPB rose six sen each to RM10.42 and RM15.32. IOI Corp and Axiata inched up two sen to RM5.11 and RM3.11 each while Petgas jumped 14 sen to RM9.87.

Volume on the Main Market was lower at 518.922 million shares worth RM995.548 million compared to Wednesday's 576.092 million shares worth RM919.768 million.
The ACE market volume, however, increased to 48.268 million shares valued at RM9.067 million from 40.049 million shares valued at RM6.879 million previously.
Warrants dipped to 14.643 million units worth RM2.635 million from 18.054 million units worth RM3.191 million yesterday. Consumer products accounted for 60.274 million shares traded on the Main Market, industrial products 69.588 million, construction 38.018 million, trade/services 176.521 million, technology 17.1 million, infrastructure 40.919 million, finance 59.675 million, hotels 1.253 million, properties 41.434 million, plantations 12.885 million, mining 21,600, REITs 1.217 million, and closed/fund 11,000.

BURSA MALAYSIA >>> Midday In Pics And Images 27 Aug 2009

Bursa Malaysia @12,30pm 27 August 2009

HAPPY TADING FOLKS & GOODLUCK2ALL

BT Featured Stock >>> 5097 KURNIA ASIA BERHAD

Kurnia Asia Berhad (KAB) was incorporated in Malaysia on 16 February 2001 as a private limited company under the name of Kurnia Asia Sdn Bhd. On 21 November 2002, the Company converted into a public limited company and assumed its present name.

KAB is the holding company which wholly owns Kurnia Insurans (Malaysia) Berhad (KIMB)- the largest general insurer in Malaysia. Since its inception, Kurnia has been growing tremendously and delivering outstanding operational results and profitability under the leadership of its hands-on and experienced management team.

Kurnia Asia Achieved Stronger Net Profit For Q3 Ended 31 March 2009
Kurnia Asia Berhad (KAB) released its unaudited financial results for the third quarter (Q3) of the financial year ending 30 June 2009 (FY2008/09) at its corporate head office in Menara Kurnia.
KAB has improved its net profit to RM14.39 million for the 9-month period ended 31 March 2009 as opposed to RM1.30 million for the corresponding period ended last year. The improved net profit is largely attributed to its sustained positive underwriting performance to date for FY2008/09 as well as a stronger investment performance achieved during the quarter under review.
Moving into the second half of FY2008/09, KAB maintained its positive underwriting performance for three consecutive quarters for the current financial year under review. The Group recorded an underwriting surplus of RM4.12 million for Q3 FY2008/09, compared to an underwriting surplus of RM5.73 million in the second quarter of the same financial year.
Hence, for the 9-month period ended 31 March 2009, KAB achieved a total underwriting surplus of RM12.53 million, a significant turnaround from an underwriting deficit of RM78.04 million incurred in the corresponding period of the previous financial year. The internal transformation and revitalization Transformation of Operations and Performance (TOP) program has indeed helped bring the Group’s underwriting results back on track.
For the 9-month period ended 31 March 2009, the Group’s claims ratio has also improved to 68.8% from 78.9% correspondingly with its strengthened claims management through TOP. The Group’s claims expenses reduced by 14.7% to RM514.3 million from RM604.1 million for the same period in the previous financial year.
KAB’s Executive Chairman, Tan Sri Dato’ Paduka Kua Sian Kooi, commented: “Amidst such a challenging environment, the Group has achieved much by turning around its operations. Nonetheless, there is still room for improvement and we will continue to innovate and change to achieve sustainable profitable growth.”
Investment income improved to RM29.58 million for Q3 FY2008/09 from RM2.67 million achieved in the previous quarter of the current financial year due to the Group’s decision to reallocate the investment portfolio to a more defensive position in view of the poor showing of the equity market. The Group will closely monitor and prudently manage its investment asset allocation to minimize as much as possible the impact of the global financial crisis on the Group’s business.
On its top line, the Group’s gross premium has remained flattish due to the more stringent risk selection process to attract quality business. Gross premium totaled RM806.6 million for the 9-month period ended 31 March 2009, a slight dip from RM832.0 million achieved in the corresponding period in the previous financial year.
In a continuous effort to enhance its services to its valued policyholders, Kurnia Insurans (Malaysia) Berhad (KIMB) has launched new services such as Kurnia Auto Assist (KAA) motorcycle riders, enhanced Kurnia Express (KE) and SMS alerts on claims update and renewal reminders among others.
While enhancing its motor portfolio quality and services, it is also expanding its non-motor contribution. For the 9-month period ended 31 March 2009, non-motor contribution to gross premium is approximately 17% at the Group level, compared to 13% for the same period in the previous financial year.
“As we enter into the last quarter of our financial year ending 30 June 2009, we are determined to achieve an even healthier performance. Looking beyond the current financial year, we have already identified key initiatives for strategic growth in our next financial year,” concluded Tan Sri Kua.

TECHNICAL ANALYSIS >>> Composite Index 26/08/2009 / 综合指数 2009年 8月 26日

Composite Index 26/08/2009
The KLCI closed slightly higher today at 1172.56 pt, with the KLCI resistance remains at 1186 pt Fibonacci Retracement (FR), while 1163 pt FR continue to serve as the support level of the KLCI.

As indicated by arrow A, the KLCI is still supported by 14, 21, 31 days Exponential Moving Average (EMA), this shows that the KLCI mid and long term trend had yet to show any weakening sign. In other words, should the KLCI continue to be supported by the 14, 21, 31 days EMA, the KLCI long term up trend is still intact, despite the short term correction and consolidation.

Volume traded declined another 10.3%, while remain lower than the 40 days Volume Moving Average (VMA), this is due to the quiet market as investors are still waiting some fresh leads. Normally, the volume will stay below 40 days average when the direction of the KLCI is unclear or during a consolidation.

The Stochastic rebounded slightly as the KLCI closed slightly higher; however, the Stochastic is still hovering below 50% (Refer to circle C), this means that the KLCI short term remains weak. Should the Stochastic break below 30% again, the KLCI will begins a new round of short term down trend. Normally after the Bollinger Bands contracted, the Stochastic needs to break above the 70%, in order for the KLCI to embark an up trend.

The KLCI continue to consolidate, as a result of a contracting Bollinger Bands, and this is a sign that the KLCI is preparing for a new trend. In short, the KLCI short term is on a weak trend; while the mid and long term has not shown any weakness yet. However, should the KLCI break blow the 14, 21 ,31 EMA, the mid to longer term movement of the KLCI is likely to turn weak.

综合指数 2009年 8月 26日

富时综合指数稍微回弹,以1172.56点挂收。综指当前的阻力水平依然是1186点的费氏线,支持水平则落在1163点的费氏线。由于综指目前正处于布林中频带(Bollinger Middle Band)的水平,再加上布林频带(Bollinger Bands)收窄9%,所以布林中频带对综指的影响暂时并不显著。

如图中箭头A所示,综指目前继续获得14、21、31天加权移动平均线(EMA)的扶持,这显示综指的中长期走势并未完全出现下跌的讯号。换句话说,只要综指继续的处于14、21、31天EMA以上,综指的长期走势依然保持在上扬格局中,只是短期出现调整或走弱的讯号。

马股成交量减少10.3%,继续的低于40天成交量移动平均线(VMA),这是市场依然淡静的讯号。一般上,在综指缺乏明确的指引或是横摆巩固(布林频带收窄)时,成交量都会低于40天成交量平均值(参考箭头B)。

随机指标(Stochastic)也跟随综指稍微回弹,惟还是低于50%的水平(参考C圈),这显示综指的短期走势仍然趋软,有待进一步改善。接下来若随机指标再度跌破30%的水平,综指的短期走势将再度出现下跌的趋势。通常在布林频带收窄后,随机指标必须上扬突破70%,综指的短期走势才有望出现上扬的格局。

综指继续横摆巩固的走势,所以布林频带亦继续收窄,这也是综指酝酿新趋势的讯号。总的来说,综指的短期走势趋软,惟中长期走势并未确认转弱的讯号。这意味着若综指跌破14、21、31天的EMA,综指将开始中长期下跌的趋势。

DOW >>> Seven Days of Gains

Wall Street was able to barely eke a seventh-straight day of gains Wednesday after a positive housing report showed new homes sales accelerated during the month of July. Investors stayed cautious on Wednesday after a rally.

For the third consecutive day, equities bounced after favorable news, but the gains fizzled. After a five-month run-up that has pushed the broader S&P 500 up 52 percent from its 12-year closing low on March 9, analysts have been questioning the rally's strength even as economic data points to improved demand.

At the 4 p.m. close in New York, the Dow Jones Industrial Average rose 4.46 points, or 0.05%, to 9543.75, the Standard & Poor's 500 gained 0.12 points, or 0.01%, to 1028.12 and the Nasdaq Composite rose 0.2 points, or 0.01%, to 2024.43.
Stocks, however, reacted little to another report from the Commerce Department that showed durable goods orders rose in July by 4.9%, the third rise in the economic indicator in four months. The rise was considerably better than the 3% rise that economists had been looking for.

What goes up must come down?
What goes up eventually comes down, even in stock markets. Still, it can take a long time, much to the chagrin of those looking for a buying opportunity.

Many have warned of a reckoning, where the stock market gives up the gains of more than 50 percent posted by major U.S. averages since March. Yet the market has gone from strength to strength as the economy emerges from the worst recession since the 1930s.
Those waiting for a much talked-of pullback of 10 percent or more may be cooling their heels for a long time, if previous market experiences are any guide. The rallies that commenced after the two most recent U.S. recessions ran longer than pessimists expected.

"You might not get that decline if that's what you're waiting for," said Cleveland Rueckert, market strategist at Birinyi Associates in Stamford, Connecticut. "A lot of people have been and probably will be surprised how far the market can go."

Six months before the United States pulled out of recession in March 1991 the stock market began to rally. Seven years later the S&P 500 .SPX had more than tripled in value without ever pulling back by 10 percent. This was not the only time markets have run ahead without a significant correction. Coming out of a bear market after the dot-com bubble, the S&P 500 surged 95 percent from 2003 to 2007, again, without a 10 percent correction.
In March, when the S&P 500 hit an intraday low below 700, investors were pricing in a doomsday scenario in the economy and financial markets. That nightmare outcome is now off the table as signs of recovery continue to sprout.

"A lot of people are coming to the realization that total meltdown is off the table," said Robert Auer, a fund manager at SB Auer Funds in Indianapolis, Indiana. "The market is up 50 percent and they just now got that message." Since March, corrections have been threatened, but none have taken place. Between mid-June and early July, the S&P 500 fell 9 percent, but buyers emerged shortly thereafter, and this has been the pattern with each mini-correction since March.

The rise comes amid a still-uncertain outlook for the economy. Rising government debt and the ongoing deleveraging of the private sector threaten economic growth. Investors took second-quarter earnings results as a positive, but companies used cost-cutting as a means to achieve better earnings, as demand was still slack. Some worry about a double-dip recession as foreclosures and commercial real-estate problems mount.

OIL FUTURES: Nymex Crude Ends Lower As Oil Stockpiles Grow
Crude futures settled lower Wednesday as U.S. oil inventories continued to rise. Light, sweet crude for October delivery settled 62 cents, or 0.9%, lower, at $71.43 a barrel on the New York Mercantile Exchange. Brent crude on the ICE futures exchange settled 17 cents, or 0.2%, lower, at $71.65 a barrel.

A return to the 10-month high of $75 a barrel hit Tuesday looked increasingly remote after the Department of Energy reported a 100,000-barrel increase in U.S. oil inventories. Inventories are about 15% higher than they were a year ago, while demand was down 0.9% in the four weeks ended Aug. 21, the department's Energy Information Administration said. Analysts had given an average forecast for a 600,000-barrel drop, according to a Dow Jones Newswires survey.

Expectations of an even bigger increase - fed by the American Petroleum Institute's report Tuesday of a 4.3-million-barrel build - prevented the bottom from dropping out of the market, traders said.

Fuel inventories are in even worse shape, with stockpiles of gasoline and distillate, a category that includes heating oil and diesel, well above average for this time of year. Gasoline inventories fell 1.7 million barrels last week, more than analysts expected, while distillate stocks rose by 800,000 barrels, topping forecasts.

"Given the supply situation, I can't see prices being able to pull away from the range we've been trading at," said Matt Zeman, president of trading at LaSalle Futures Group in Chicago. "Temporarily, the highs are probably in."

Wednesday, August 26, 2009

NIAGA HADAPAN DERIVATIF MINYAK SAWIT MENTAH (MSM) DAN FBMKLCI

HARGA MSM DITUTUP TINGGI
Niaga hadapan Minyak Sawit Mentah (MSM) di Bursa Malaysia Derivatif ditutup lebih tinggi berikutan jangkaan permintaan yang lebih tinggi sebelum musim perayaan, kata para peniaga.
Mereka berkata kemunculan minat untuk membeli di tengah-tengah kebimbangan mengenai produktiviti yang lebih rendah terus menyokong pasaran. Harga MSM dijangka berkisar sekitar antara paras sokongan RM2,350 setan metrik dan halangan pada RM2,400 setan metrik, kata salah seorang peniaga itu.
Kontrak September 2009 meningkat RM11 untuk ditutup kepada RM2,449 setan metrik.
Oktober 2009 meningkat RM2 kepada RM2,385 setan metrik,November 2009 meningkat RM2 kepada RM2,357 tetapi Disember 2009 turun RM3 kepada RM2,350 setan metrik.
Jumlah dagangan merosot kepada 15,048 lot daripada 18,429 lot semalam manakala minat terbuka merosot kepada 84,537 kontrak daripada 86,426 kontrak sebelum ini.
Di pasaran tunai, Ogos Selatan meningkat RM10 kepada RM2,480 setan metrik.

NIAGA HADAPAN FBM KLCI DITUTUP RENDAH
Kontrak hadapan Indeks Komposit Kuala Lumpur FTSE Bursa Malaysia (FBM KLCI) di Bursa Malaysia Derivatif ditutup rendah hari ini di sebalik pasaran tunai yang lebih kukuh, kata para peniaga.
Kontrak Ogos 2009 turun 2.0 mata kepada 1,169.0 sementara September 2009 dan Disember 2009 masing-masing jatuh 2.5 mata kepada 1,168.0 dan 1,163.5. Mac 2010 jatuh 3.5 mata kepada 1,157.5.
Jumlah dagangan menambah kepada 15,296 lot berbanding 12,346 lot semalam dan kepentingan terbuka meningkat kepada 22,404 kontrak daripada 20,635 kontrak sebelumnya.
Kadar asas FBM KLCI meningkat 1.47 mata untuk ditutup kepada 1,172.56 hari ini.

BURSA MALAYSIA: Share Prices End Firmer On Buying Of Selected Heavyweights

Share prices on Bursa Malaysia ended the day firmer with buying in selected heavyweights such as Sime Darby and Tenaga Nasional, dealers said. However, the gains were limited by losses in other counters such as Maybank, they said.
The FTSE Bursa Malaysia Kuala Lumpur Composite Index (FBM KLCI) ended 1.47 points higher or 0.126 per cent better at 1,172.56, after opening unchanged at 1,171.09 in the morning.
MIMB Investment analyst, Rosnani Rasul said the market was expected to remain rangebound this week in the absence of fresh leads.

"It will be like this at least until the results season is over," she said.

She added that the catalysts in the U.S. which spurred the market were not strong enough to boost the local market. Jupiter Securities head of research, Pong Teng Siew said the market was down not only due to Maybank's lower financial results announced here Tuesday, but also the volatile Chinese market which it tracks.

"Investors know that if the Chinese market swings into the negative, it will take down the regional markets as well. So now, nobody is buying aggressively," he said.

At 5pm, the Finance Index was up 9.631 points at 9,495.98 while the Plantation Index declined 10.2 points to 5,826.53 and the Industrial Index increased 8.18 points to 2,583.72.
The FBM Emas Index gained 15.73 points to 7,920.2, the FBM Top 100 went up 14.44 points to 7,698.78 and the FBM ACE Index rose 2.43 points to end at 4,172.57.

Losers led gainers 363 to 259 while 241 counters closed unchanged, 382 untraded and none suspended.
Turnover however, fell to 636.267 million shares worth RM930.776 million from 709.248 million shares worth RM985.757 million yesterday.

Of the volume leaders, Oilcorp gained three sen to 41.5 sen and Kurasia went up 4.5 sen to 57.5 sen. KNM and Plus each rose one sen to 77 sen and RM3.38 respectively while Yunkong-WA inched up 1.5 sen to 17.5 sen.

The top gainers included Nestle which rose 56 sen to RM34.00, LaFarge Cement which went up 34 sen to RM6.50 and Tomei which advanced 30 sen to 80 sen.
The top losers included DiGi which fell 26 sen to RM21.72, Huatlai which dropped 23.5 sen to 51.5 sen and Petra which lost 19 sen to RM2.49.

Among the heavyweights, Sime Darby rose one sen to RM8.23 while Maybank lost five sen at RM6.47 and Bumiputera-Commerce was flat at RM10.36. Tenaga Nasional gained nine sen to RM8.10 and Genting went up seven sen to RM6.54.

Volume on the Main Market was lower at 576.092 million shares worth RM919.768 million compared to Monday's 650.807 million shares worth RM973.945 million.
The ACE market volume, however, increased to 40.049 million shares valued at RM6.879 million from 29.934 million shares valued at RM5.924 million previously.
Warrants dipped to 18.054 million uits worth RM3.191 million from 25.842 million units worth RM4.843 million yesterday.

Consumer products accounted for 47.493 million shares traded on the Main Market, industrial products 123.204 million, construction 25.721 million, trade/services 200.227 million, technology 26.982 million, infrastructure 11.711 million, finance 65.881 million, hotels 1.532 million, properties 58.884 million, plantations 12.978 million, mining 4,000, REITs 1.453 million, and closed/fund 17,600.