ZLBT Chats

Wednesday, March 31, 2010

FBM KLCI Futures >>> Market Overview

FKLI End Mostly Firmer
The FTSE Bursa Malaysia Kuala Lumpur Composite Index (FBM KLCI) futures contracts on Bursa Malaysia Derivatives ended mostly firmer Wednesday in line with the higher cash market, dealers said.

At the close of trading, the March 2010 contract fell 1.5 point to 1,316.5 while April 2010 increased 6.5 points to 1,326.5.

June 2010 gained 8.0 points to 1,325.0 and September 2010 went up 6.5 points to 1,322.0.

Turnover was lower at 8.704 lots compared to Tuesday's 12,585 lots and open interests slipped to 26,814 contracts from 29,121 contracts before.

The benchmark FBM KLCI ended 1.22 points higher at 1,320.57.

Dow Notches 18-Month High

Dow Powers Above 10,900, Despite Sleepy Session
Despite a round of generally positive economic data, stocks had trouble finding a foothold on positive ground today. Bright and early, investors learned that the S&P Case-Shiller home-price index fell 0.7% in January, marking its slimmest annual decline in nearly three years, while home prices edged 0.3% higher on a monthly basis. Elsewhere, the Conference Board reported that its consumer confidence index jumped to 52.5 in March, reversing a portion of the previous month's steep drop. However, traders also considered a dismal bond sale by Greece, along with a credit-rating downgrade for Iceland from Standard & Poor's. With concerns about the global economy still weighing heavy -- and with the week's marquee payrolls report looming on Friday -- most traders seemed content to watch the market chop sideways throughout today's session.

The Dow Jones Industrial Average (DJIA – 10,907.42) ended the day on a slim gain of 11.6 points, or 0.1%, as exactly half of its 30 components made the trek higher. Verizon Communications (VZ) and 3M Company paced the 15 advancing blue chips, while AT&T (T) set the pace for the 15 laggards. While today's climb seems relatively tame, it actually marks the Dow's first close above 10,900 -- as well as its highest daily close -- since Sept. 26, 2008.

Meanwhile, the S&P 500 Index (SPX – 1,173.27) finished almost flat, adding just 0.05 point by the close. Today's stagnant action aside, the SPX is still poised to notch a key victory above its 160-month moving average in tomorrow's trading.

Finally, the Nasdaq Composite (COMP – 2,410.69) also crept higher, tacking on 6.3 points, or 0.3%. The COMP's intraday low was neatly contained by short-term support at its 10-day moving average, though the tech-rich index remains pinned by the looming 2,420 level.

Crude futures inched higher today, with traders taking their cues from the day's upbeat data on housing and consumer confidence. However, following a steep rally on Monday, the hot commodity's gains were relatively modest ahead of tomorrow's inventory reports. Plus, thanks to fresh concerns about the global economy, a strong day for the U.S. dollar further limited oil's positive momentum. By the close, crude oil for May delivery tacked on just 20 cents, or 0.2%, to end at $82.37 per barrel.

Saturday, March 27, 2010

Street Bulls Run Into Wall Amid Geopolitical Fears

Stocks End Mixed as Traders Weigh Greece, Korea
In an eerie replay of Thursday's trading, stocks spent the first half of the day marching boldly higher, but found themselves barreling back toward breakeven by midday. An upbeat report on consumer confidence helped buoy the bulls in early trading, as the University of Michigan/Reuters index came in higher than expected for March. News from overseas also contributed to morning gains, as the International Monetary Fund (IMF) struck a deal with euro zone leaders to bail out floundering member country Greece.


However, news from overseas also sparked the afternoon sell-off, as a South Korean Navy ship sank in the Yellow Sea following what many feared was a torpedo launch by North Korea. After the initial shockwaves wore off, U.S. stocks tentatively resumed their march higher. Despite a slim weekly victory for the bulls, the day ended on a decidedly mixed note.

By the close, the Dow Jones Industrial Average (DJIA – 10,850.36) was sitting on a gain of 9.2 points, or 0.08%. Nineteen of the 30 blue chips closed higher, with Alcoa pacing the advancing equities. On the other side of the coin, Pfizer and Microsoft set the tone for the 11 decliners.

The Dow added 1% for the week, and notched its highest weekly finish since Sept. 26, 2008.

The S&P 500 Index (SPX – 1,166.59) also elbowed its way higher, tacking on 0.9 point, or 0.07%. The SPX managed a weekly close above its key 160-month moving average for the first time since September 2008. Finally, the Nasdaq Composite (COMP – 2,395.13) was unable to reclaim its perch in positive territory, settling for a drop of 2.3 points, or 0.1%. Nevertheless, the COMP managed its highest weekly close since Aug. 22, 2008. For the week, the SPX added 0.6%, while the COMP added 0.9%.

TECHNICAL ANALYSIS >>> Composite Index 26/03/2010 / 综合指数 2010年 03月 26日

Composite Index 26/03/2010
As indicated by A, the FBM KLCI rose 2.66 points, to close at 1315.14 points. Support for the KLCI is at 1308.39 which is the 23.6% Fibonacci Retracement line, and the resistance is at 1334.34 Automatic Fibonacci Retracement.

As shown on the chart above, the Bollinger Bands contracted 15%, suggesting that the KLCI is still consolidating while preparing for a new movement. However, the immediate technical outlook is positive as the KLCI is now above the Bollinger Middle Band.

As indicated by B, total market volume increased only 0.5%, but still firmly above the 40-day VMA level, suggesting that the market is still well-participated. This is a positive element which would help lift the market sentiment.

As indicated by C, the Stochastic touched 100% level, suggesting that the short term movement of the KLCI is indeed bullish but over-heated. Nevertheless, provided that the Stochastic is still above 70%, the short term bullishness of the KLCI shall remains intact.

In conclusion, the KLCI is still consolidating while preparing for a new movement, and we shall wait for the re-expansion of the Bollinger Bands, then to determined the new direction with the guidance of the Bollinger Middle Band.


综合指数 2010年 03月 26日
如图中箭头A所示,富时综合指数微升2.66点,以1315.14点闭市,综指当前的支持水平仍然维持在1308.39点的23.6%费氏支持线,阻力水平则是1334.34点的费氏线。
如图所示,布林频带(Bollinger Bands)进一步收窄15%,这表示综指依然处于巩固的格局,与此同时,综指也是正在酝酿着一个新趋势。由于综指目前已经处于布林中频带(Bollinger Middle Band)以上,所以接下来若布林频带开始打开,那综指出现上扬趋势的机会浓厚。

如图中箭头B所示,虽然马股成交量只增加0.5%,不过成交量依然维持在40天成交量移动平均线(VMA)以上,这表示市场仍然有足够的承接力量,这将有助于综指继续转强。

如图中箭头C所示,随机指标(Stochastic)上扬100%的水平,这显示综指处于短期涨势中,虽然达到100%显示过热,不过只要随机指标能继续维持在70%以上,那综指将有进一步走高的可能。

总的来说,综指目前正在酝酿着一个新的趋势,虽然技术指标显示综指转为上扬的机会浓厚,不过一般上必须等待布林频带开始打开,届时综指处于布林中频带的相应位置才能决定综指新趋势的方向。

Friday, March 26, 2010

TECHNICAL ANALYSIS >> 综合指数 2010年 03月 25日 / Composite Index 25/03/2010

综合指数 2010年 03月 25日
如图中箭头A所示,富时大马创业板周四继续回弹,惟精确的在14天的加权移动平均线(Exponential Moving Average - EMA)遇阻,按日上扬3.3点或0.1%。于此来看,14、21、31天EMA依然是创业板的动态阻力线(Dynamic Resistance),而富时大马创业板仍然还未摆脱偏弱的格局。
如图所示,创业板支持水平依然是4180点的费氏线,阻力水平除了是14、21、31天的EMA以为,便是4296点的费氏线。

如图中B圈所示,随机指标(Stochastic)周四继续上扬,并且稍微突破70%水平。这表示创业板当前依然处于技术反弹的格局中。接下来若随机指标能维持在70%水平以上,那创业板短期的走势有望继续改善,或有转强的机会。

如图中箭头C所示,平均乖离振荡指标(MACD Histogram)继续微扬,并且突破了零轴。这表示创业板当期正处于技术反弹,或有转强的迹象。以技术而言,只要平均乖离振荡指标能继续上扬,那创业板走势将继续改善,直到平均乖离振荡指标形成相对的圆顶(Rounding Top)为止。

总的来说,辅助指标虽然继续显示富时大马创业板转强的迹象,惟创业板依然在14、21、31天的EMA遇阻,所以未能确认转强的讯号。无论如何,所有的涨势都是从技术反弹慢慢的演变而来,所以投资者可以继续留意创业板是否能上扬突破14、21、31天的EMA,创业板随后若形成较高底(Higher-Low)时,便是形成涨势的特征之一。


Composite Index 25/03/2010
The KLCI gained 3.03 points on Thursday, to close at 1312.48 points. The KLCI is currently supported by the 1308 Automatic Fibonacci Retracement, which is the 23.6% Fibonacci Retracement line, and the resistance for the KLCI is at 1334.34 Automatic Fibonacci Retracement.

As indicated by A, the Bollinger Bands contracted 23%, suggest that the KLCI is still consolidating, and also preparing for a new movement, and the new movement shall begin when the Bollinger Bands re-expands, and the direction shall be determined by the relative position of the KLCI against the Bollinger Middle Band.

As indicated by B, total market volume increased 9.5%, with volume firmly above the 40-day VMA level. The increased of volume suggests an improvement of the market participation, thus implies that the investors confidence is gradually recovering.

As indicated by C, the Stochastic breaks above 50% level, suggesting that the KLCI continues its technical rebound. If the Stochastic should break above 70% level, it would be a short term bullish signal for the KLCI.

In conclusion, the contraction of the Bollinger Bands suggests that the KLCI is now gearing up for a new movement, and we shall wait for the re-expansion of the Bollinger Bands. If the Bollinger Bands should expands with the KLCI above the Bollinger Middle Band, together with the Stochastic breaking above 70% level, it would be an ideal bullish signal, and of course, volume has to stay above the 40-day VMA level.

Thursday, March 25, 2010

BT Crude Oil and Gold Infos and Updates

Crude futures tumbled to a seven-session nadir today, thanks to a heftier-than-expected increase in domestic supplies, as well as a strengthening dollar. The Energy Information Administration (EIA) said crude inventories advanced by 7.25 million barrels last week, significantly exceeding economists' forecast of a 1.4 million barrel surplus. Meanwhile, debt woes out of Europe fueled the greenback higher against most of its rivals, making dollar-denominated commodities – like oil – more expensive for holders of foreign currencies. By the close, May-dated crude oil surrendered $1.30, or 1.6%, to finish at $80.61 per barrel.


Gold futures also retreated in the wake of a stronger dollar. Ratings downgrades for Portugal pressured the euro to a 10-month low against the greenback, as commodities traders grow more concerned that the continent's debt concerns span wider than Greece. Against this backdrop, gold for April delivery gave up $14.90, or 1.4%, to settle at $1,088.80 an ounce.

FBM KLCI Futures >> Data and Infos in Images

Please click on images to ENLARGE

RECOMMENDATION

BUY / LONG when FKLI goes into DISCOUNT or within

GOODLUCK2U

Wednesday, March 24, 2010

BURSA MALAYSIA >>> Market Overview


Share prices on Bursa Malaysia ended higher on Wednesday, buoyed by the overnight rally in US stocks.

Dealers said signs of the US housing market bottoming-out also boosted sentiment but gains were limited with profit taking among heavyweights.

They said the release of Bank Negara Annual Report 2009 at 6 pm today could have some impact on the market as investors would see the central bank's gross domestic product (GDP) projection for this year.

The benchmark FTSE Bursa Malaysia Kuala Lumpur Composite Index advanced 4.60 points to 1,309.45, after opening 4.91 points higher at 1,309.76.

The Finance Index surged 95.601 points to 11,679.78, the Plantation Index gained 15.48 points to 6,409.5 and the Industrial Index rose 14 points to 2,640.94.

The FBM Emas Index advanced 45.109 points to 8,829.81 and the FBM70 increased 64.311 points to 8,656.74 and the FBM Ace Index rose 50.89 points to 4,208.39.

Advancers outpaced decliners by 453 to 255 while 295 counters were unchanged, 344 untraded and 30 others suspended.

Turnover increased to 1.136 billion shares worth RM1.688 billion from 907.73 million shares worth RM1.487 billion yesterday.

Among heavyweights, Maybank gained four sen to RM7.45, Sime Darby rose two sen to RM8.52, CIMB Group Holdings increased 26 sen to RM13.74 and Maxis was flat at RM5.35.

Among active stocks, Integrated Rubber Corporation slipped three sen to RM1.17, AE Multi Holdings added 6.5 sen to 76.5 sen, Time Dotcom perked 5.5 sen to 49.5 sen and Privasia Technology was flat at 9.5 sen.

Turnover on the Main Market increased to 967.016 million shares valued at RM1.639 billion from 791.469 million shares valued at RM1.463 billion yesterday.

The Ace market volume was higher at 97.48 million shares worth RM14.1 million from 66.838 million shares worth RM9.23 million yesterday.

Warrants increased to 41.08 million units valued at RM9.005 million from 31.83 million units valued at RM4.66 million yesterday.
HAPPY TRADING

Hot Dow Heats Up To 17-Months High

The Nasdaq Composite finished atop the 2,400 level for the first time since August 2008
The major market indexes continued to explore new heights today, with help from a batch of better-than-expected housing data. More specifically, the National Association of Realtors said existing home sales backpedaled by 0.6% to an annual rate of 5.02 million in February, narrower than the expected decline to 5 million units. While sales of previously owned homes are now at their lowest level in eight months, today's data left the Street optimistic ahead of the Commerce Department's monthly report on new home sales, slated for release tomorrow. Against this backdrop – and thanks to some long-awaited closure on the health care front – stocks extended their rally into the close, with the bulls on pace for a solid first-quarter finale.

The Dow Jones Industrial Average (DJIA – 10,888.83) finished near its intraday peak of 10,893.89 today, adding 102.9 points, or 1%, as 28 of its 30 components ended higher. Caterpillar and Kraft Foods paced the advancing equities, while Home Depot and Exxon Mobil bucked the trend.

Today marks the Dow's highest daily close since Sept. 26, 2008 – meaning the blue-chip barometer is fast approaching pre-financial-crisis levels.

In similar fashion, the S&P 500 Index (SPX – 1,174.17) tacked on 8.4 points, or 0.7%, to settle at its highest level since Sept. 26, 2008. Thanks to the SPX's impressive technical prowess of late, the index is poised to close the month atop its 160-month moving average. Not to be outdone, the Nasdaq Composite (COMP – 2,415.24) wrapped up the day on a gain of 20 points, or 0.8%, to finish atop the 2,400 level for the first time since Aug. 18, 2008.

Both the SPX and COMP settled just a hair's breadth shy of their intraday peaks of 1,174.72 and 2,416.51, respectively.

CAVEAT VENDITOR
Sellers Beware!!!

Tuesday, March 23, 2010

TECHNICAL ANALYSIS >> 综合指数 2010年 03月 23日 / Composite Index 23/03/2010

综合指数 2010年 03月 23日
富时综合指数周一在1292点的38.2%费氏线上获得扶持后继续回弹,上扬11.20点,以1304.85点闭市,成功的回弹至1300点的心理水平以上。综指当前的阻力水平是1308点的费氏阻力线,支持水平则是1292点的费氏线。
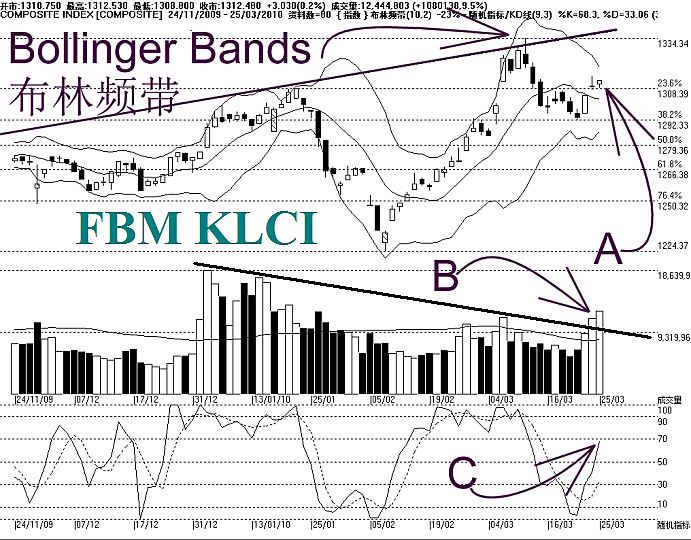
如图所示,综指上探至布林中频带(Bollinger Middle Band)的动态阻力线(参考图中箭头A),惟综指最终仍然受到布林中频带的阻力,未能成功突破。接下来布林中频带继续的成为综指的主要阻力,若综指能上扬突破布林中频带的话,那综指的后市将有望摆脱下跌的窘境。

如图中箭头B所示,虽然马股成交量增长34.5%,这使到成交量成功的超越40天成交量移动平均线(VMA)的水平,这显示整体交投活跃,市场的承接力量也随之增加,这对综指开始转强是有利的。
如图中箭头C所示,随机指标(Stochastic)回弹,这表示综指有望出现技术回弹,无论如何,随机指标还未成功的突破30%,所以综指的短期走势并未完全确定综指出现上扬趋势。换句话说,接下来若随机指标成功突破30%的水平,那综指的短期走势将进入技术反弹的格局。

综指在1292点的费氏线获得支持,由于这也是14、21、31天的加权移动平均线(EMA)的支持点,所以综指回弹。接下来若综指能突破布林中频带,那综指转强的机会将有望提高,届时若能再配合布林频带开始明显打开的话,那综指则有望恢复上扬的趋势。

Composite Index 23/03/2010
The KLCI rebounded 11.20 points, after being supported by the 38.2% Fibonacci Retracement, and the KLCI closed at 1304.85 points, breaking above the 1300 level. Immediate resistance for the KLCI is at 1308 Fibonacci Retracement while the support is at 1292 Fibonacci Retracement.

As indicated by A, the KLCI is testing the Bollinger Middle Band, which is the dynamic resistance. If the KLCI should break above the Bollinger Middle Band, it would break away from the bearish biased short term movement, and there is a better chance of resuming its uptrend.

As indicated by B, total market volume increased 34.5%, breaking above the 40-day VMA level. This suggests that the market participation is now at a healthy level. Generally, if volume should stay above the 40-day VMA level, the market sentiment is likely to improve.

As indicated by C, the Stochastic rebounded, but still has not broken above 30% level. If the Stochastic should break above 30% level, it would be a beginning of a technical rebound for the KLCI.

In conclusion, the KLCI rebounded from 1292 Fibonacci Retracement, which is also the similar level of the 14, 21, 31 EMA. If the KLCI could take out the resistance at the Bollinger Middle Band, the uptrend is likely to resume when the Bollinger Bands should re-expands.

Bulls Overrun Bears After Early Dip into the Red

The Nasdaq Composite tagged new annual highs
Despite an early dip into the red this morning, the equities market kicked off the week on a high note today. Hospital stocks and managed-care providers emerged as unexpected leaders, after the U.S. House of Representatives voted -- along strict party lines -- to approve an overhaul of the nation's health care system. While many analysts predicted that reform would be a negative catalyst for the sector, traders today were simply relieved to see some of the uncertainty surrounding health care stocks lifted. Elsewhere, an upgrade for Boeing (BA) added some lift to the Dow industrials, while Citigroup (C) paced financial sector gainers after analyst Richard Bove boosted the shares from "neutral" to "buy." By the close, all three major market indexes were firmly planted on positive ground.

The Dow Jones Industrial Average (DJIA – 10,785.89) ended on a gain of 43.9 points, or 0.4%, as 22 of its 30 components closed higher. DuPont (DD) and American Express (AXP) paced the advancing equities, while United Technologies (UTX) led the seven declining blue chips into the red. General Electric (GE) shares split the difference by finishing flat. Today marks the Dow's highest daily close since Oct. 1, 2008.

In similar fashion, the S&P 500 Index (SPX – 1,165.81) tacked on 5.9 points, or 0.5%, after catching a lift from its rising 10-day moving average. The SPX remains pinned beneath short-term pressure at the 1,170 level, but it's once again trading north of its 160-month trendline. Not to be outdone, the Nasdaq Composite (COMP – 2,395.40) wrapped up the day on a gain of 21 points, or 0.9%, after tapping an intraday peak of 2,401.21 -- its highest price since Sept. 2, 2008.


HAPPY TRADING

Saturday, March 20, 2010

Further rise in CPO futures expected

Crude palm oil (CPO) futures traded on Bursa Malaysia Derivatives are expected to be higher next week, in tandem with the gains of other commodities such as crude oil and soyoil, said a dealer.

A continued increase in crude oil prices would boost CPO prices as it is used to produce bio-diesel, and demand for soya bean is also surpassing supply, he said.

Palm oil output in Malaysia, the second-largest producer, may decline between 2 and 3 per cent this year, as El Nino cuts yields, said Boon Weng Siew, president of the Malaysian Estate Owners Association, which represents small and medium-sized growers. The nation produced 17.6 million tons last year.


“That’s the first reason,” Joelianto, head of trading at Jakarta-based PT Sinar Mas Agro Resources and Technology, said by phone yesterday. Prices also gained as investors covered bets on declines, he said. Dry weather was forecast to persist in Sabah, Malaysia’s largest palm-oil-producing region, and other parts of the country through to May, the Meteorological Department said on March 12. The state accounted for 35 per cent of Malaysia’s output in the first two months of the year, according to data from the country’s Palm Oil Board.

El Nino, which reduces rainfall in Asia, may cause Malaysia to miss a government output forecast for palm oil of 18.1 million tons, Dorab Mistry, a director at Godrej International Ltd, one of India’s biggest vegetable oil buyers, said March 9. Output this year may be 17.2 million tons, Mistry said.

However, buyers will continue to be concerned over the rising US dollar as the CPO is traded in the greenback.

Experts told participants of the recent Palm and Lauric Oil Conference that CPO prices are likely to trade between RM2,800 per tonne and RM3,200 per tonne in the second-half of this year and the first-half of 2011.

Prices may rise to as much as RM3,300 in the first half of the year amid the drop in supply, Anne Frick, vice president for research at Prudential Bache Commodities LLC, said on March 8. The commodity may touch RM3,200 in the second half, Mistry said the following day. Still, producers in Indonesia and Malaysia tracked by OCBC Investment Research Pte Ltd may post higher output this month as the dry weather’s impact on yields won’t be felt until six months later, Carey Wong, an analyst at the bank, said by phone today. Wong didn’t identify producers.

For the week just-ended, the CPO futures settled weaker compared to the preceding week, although a rebound on Friday reduced losses.
On a Friday-to-Friday basis, the April 2010 contract shed RM40 to RM2,620, May 2010 slipped RM76 to RM2,583 and June 2010 declined RM66 to RM2,577.

The total weekly turnover increased to 95,505 lots from 63,055 lots last week, while open interests on Friday fell to 81,225 contracts from the 82,037 contracts previously.

On the physical palm oil market, March South slipped RM40 to RM2,630 per tonne

Thursday, March 18, 2010

Markets and Commodities Charts / Images


HAPPY TRADING & GOODLUCK2ALL

Wednesday, March 17, 2010

Historic Low Rates Fuels 6th Day Gains; Dollar Slides

S&P 500 Finds Fresh Annual High as Fed Stands Pat
The Federal Open Market Committee (FOMC) took the spotlight today, and the central bankers shocked absolutely no one by voting to maintain interest rates at their current, rock-bottom levels. The FOMC also reiterated its stance that economic conditions are "likely to warrant exceptionally low levels of the federal funds rate for an extended period."


The initial reaction to the Fed announcement was modestly positive, with stocks clinging to small gains, but the bulls' momentum w
as dampened by the day's downbeat housing data. The Commerce Department broke the bad news that housing starts dropped by nearly 6% in February, as severe winter weather put a freeze on home building. While stocks maintained a tenuous grip on positive territory through most of the session, a last-minute buying push left the major market indexes hovering near their intraday highs.

The Dow Jones Industrial Average (DJIA – 10,685.98) settled with a respectable gain of 43.8 points, or 0.4%, as all but seven of its 30 components finished higher. General Electric and Intel paced the 23 advancing equities, while Boeing set the tone for the six decliners. Meanwhile, Pfizer shares finished the day right where they started. Today's modest rally in the Dow was stopped short by the 10,700 level, which could act as short-term pressure for the blue-chip barometer.

The S&P 500 Index (SPX – 1,159.46) one-upped the Dow by notching a fresh 52-week high of 1,160.28, before wrapping up the session on a gain of about 9 points, or 0.8%. The SPX is solidifying its foothold north of the key 1,150 level. In similar fashion, the Nasdaq Composite (COMP – 2,378.01) tagged a new annual peak of its own, jumping as high as 2,378.84 today -- its best price since Sept. 2, 2008. The COMP tacked on 15.8 points, or 0.7%, by today's closing bell.

The Dow 5 mins chart shows how the day played out. The action drifted to flat ahead of the FOMC announcement, then after the typical post-Fed-stutter-step, buyers stepped in for the final hour. The S&P 500 finally hurdled it's resistance.

All of the indexes remain in overbought territory but the SPX and COMP both sit above support. The DJIA is now in a position to challenge its highs from January so that is what I will be watching next. And that is where I will pick up in the morning.

And that is where I will pick up again next morning.
Have a pleasant trading day.

TECHNICAL ANALYSIS >> Composite Index 16/03/2010 / 综合指数 2010年 03月 16日

Composite Index 16/03/2010
The KLCI had its intra-day low reaching 1295.31 points, but it managed to rebound from the 14-day Exponential Moving Average (EMA), forming a rather narrow candlestick. This suggests a mixed signal, implying that the 14, 21, 31 EMA is likely to support for the KLCI for now. As indicated by A, the 14-EMA now serves as the dynamic support for the KLCI while the next support is at 1292.33 Automatic Fibonacci Retracement. Resistance for the KLCI is at 1300 level and 1308 Automatic Fibonacci Retracement.

As indicated by B, total market volume declined another 11.2%, with volume remains below the 40-day VMA level. Therefore, this shows that the market is lightly participated, which is quite normal for the KLCI is having its technical correction.


As indicated by C, the Stochastic is now testing the 30% level, and if the Stochastic should break below
30%, it would enter a short term bearish territory, and the short term movement of the KLCI is expected to weak.

In conclusion, since being resisted by the L1 resistance line, the KLCI has continuously fallen for 4 days. With the KLCI temporary stopped by the 14-day EMA, there is a chance of a rebound above the 14-day EMA line.

综合指数 2010年 03月 16日
富时综合指数一度下滑至1295.31点的全日最低点,惟综指随后在14天加权移动平均线(EMA)获得扶持,综指形成一个小阴阳烛(Small Candle),这表示综指的买方及卖方出现势均力敌的状态,这通常是综指获得扶持的迹象。

如图中箭头A所示,综指精确的在14天EMA上获得扶持,这是综指当期的动态支持线,综指下一道支持水平则是处于1292.33点的费氏线,阻力水平则是1300点的心理阻力及1308点的费氏阻力线。

如图中箭头B所示,马股成交量减少11.2%,所以成交量持续的低于40天成交量移动平均线(VMA)的水平,这是综指维持在调整巩固或淡静格局的典型状态。一般上,成交量将继续的维持在40天VMA以下,直到交投再度活跃为止。

如图中箭头C所示,随机指标(Stochastic)在30%的水平徘徊,这显示综指的短期走势并未进入跌势,接下来若随机指标在30%回弹,这将是综指成功避开进入短期跌势的讯号,通常这也意味着综指有望出现技术反弹。

总的来说,综指自在L1的上扬趋势阻力线遇阻后,连续下滑了4日,由于综指在14天EMA上获得扶持,再加上随机指标并未跌破30%的水平,所以若外围因素不变,那接下来综指将有望出现技术反弹。

Tuesday, March 16, 2010

Bull Chips Battle Back In Eleventh-Hour Rebound

Blues Led Dow Rebound From Red To Green
Stocks wallowed in the red for most of the session today, thanks to escalating concerns about the health of the global economy. In the East, Chinese Premier Wen Jiabao noted the country's difficult task of simultaneously managing "inflation expectations" while promoting economic growth, which accelerated fears that China's central bank will take further steps to curb lending. Elsewhere, Moody's Investors Service added fuel to the bearish fire, warning of ratings-related risks for a slew of economic powerhouses, including France, Germany, Great Britain, and the U.S.

Nevertheless – and despite lingering jitters ahead of the Federal Reserve's interest-rate policy meeting tomorrow – the blue chips battled back in the final hour of trading, with the Dow Jones Industrial Average muscling higher by the close.
The Dow (DJIA – 10,642.15) recovered from an early deficit to add 17.5 points, or 0.2%, marking the index's fifth straight day of gains. Caterpillar led the 11 declining blue chips, while Wal-Mart paced the 18 advancing issues following an upgrade to "buy" at Citigroup; shares of Bank of America finished right where they began.

Meanwhile, the S&P 500 Index (SPX – 1,150.51) eked out a gain of 0.5 point, or 0.1%, to close just a hair's breadth north of the 1,150 level. However, despite a valiant rebound attempt, the Nasdaq Composite (COMP – 2,362.21) wasn't as fortunate as its broad-market brethren, swallowing a loss of 5.5 points, or 0.2%, by the close.

I am not sure I really call a 17 point gain a sign of strength but the Dow did at least manage to rebound from its lows. The charts are signalling the indexes are still showing overbought readings.

While The Nasdaq remain above it's January high, the SPX is challenging its former highs and the Dow has yet to mount an assault. That is the same technical picture we have seen for the whole of last week (though it feels like an eternity). The obvious change here is that I have added short-term trendlines to highlight the current trends. Simple trendlines like this have many failings in terms of being predictive tools but I stIn other words, they offer an easy way to gauge when the speed of a trend may be changing. With the indexes overbought, this gives a quick way to judge any pullbacks or consolidations thus suggesting we may not even see a pullback this week.

Have a nice trading day &GOODLUCK2ALL

Crude Oil Futures
Crude oil futures tumbled to a near two-week nadir today, as concerns about both China's monetary policy and the debt ratings of a few economic powerhouses fueled the dollar higher. In addition, anxiety ahead of the Federal Reserve's interest-rate meeting bolstered the greenback into the black, making dollar-denominated commodities – like crude oil – more expensive for holders of foreign currencies. By the close, crude oil for April delivery gave up $1.44, or 1.8%, to settle at $79.80 per barrel.

GOLD Futures
A dismal day in the equities market boded well for gold futures today, as investors flocked to less risky assets. Concerns about the sovereign debt of big-time economic bodies escalated gold's appeal as a safe-haven asset, which offset the dollar's typically negative impact on the malleable metal. By the close, April-dated gold futures added $3.70, or 0.3%, to finish at $1,105.40 an ounce.

FBM KLCI Futures >>> Market Overview

All FKLI contracts ended lower but at premium
All the KLCI Futures contracts ended lower Monday but closed at premiums ranging from 0.3 to 3.3 points to the underlying.

The March contract lost 13.0 points to 1,303.0 points, trimming its premium of 4.80 points to the cash market last Friday to 3.33 points. The contract opened 0.5 of a point lower at the day’s highest level of 1,315.5 points and moved to a low of 1,301.5 points during the day.

The April contract also closed 13.0 points lower at 1,302.0 points, which represents a premium of 2.33 points to the underlying against a premium of 4.80 points last Friday. It however opened 0.5 of a point firmer at 1,314.5 points and traded between 1,301.5 and 1,315.0 points during the day.

The June contract shrank 12.5 points to 1,302.5 points, representing a premium of 2.83 points, while the September contract closed 13.0 points weaker at 1,300.0 points, which is a marginal premium of 0.33 points.


BT recommend a FKLI BUY when SPOT month goes DISCOUNT
HAPPY TRADING & GOODLUCK2ALL

Monday, March 15, 2010

Harga CPO terus melemah

Harga CPO menurun untuk ketiga harinya mengikuti harga minyak dan kekhawatiran terhadap pasokan harga kedelai dari Amerika Selatan, sehingga menurunkan permintaan terhadap penggantinya.


Harga kontrak CPO menyerah 59 ringgit untuk pengiriman Mei menurun 2.23% ke level 2.590 ringgit atau US$780 per metrik ton di Malaysia Derivatives Exchange selepas diperdagangkan di level 2.612 ringgit pada pembukaan niaga pagi ini. Harga CPO menetup dengan harga 2,649 ringgit pada hari Jumaat minggu lepas.

Harga minyak mentah untuk pengiriman April di New York melemah 0,6% ke posisi US$80,75 per barel di pasar Asia. Harga CPO yang digunakan sebagai bahan baku bakar pengganti melemah 0,8% pada pekan lalu karena harga minyak menyah menurun 0.3%.

Laporan dari RHB Research Institute Sdn menyatakan penurunan harga minyak mentah bisa terjadi pada pekan ini.

Harga kedelai diperdagangkan di Chicago untuk pengiran Mei turun 0,4% ke posisi US$9,22 per bushel setelah kehilangan 1,8% pada pekan lalu.