ZLBT Chats

Friday, December 28, 2012

FCPO Daily Technical Analysis 28 Dec 2012

The FCPO active month contract ended sharply higher on Thursday, due to electronic soybean oil prices traded higher which had boosted the local market sentiment. At the close, the FCPO price had added 49 pts to 2,479.

Based on the daily chart, a long positive candle had formed on Thursday where it indicated that buyers were aggressive throughout the day.  During the trading sessions, the FCPO price went up to as high as 2,484 where the upside gap nearly covered. As we can see in the chart, the trend is positive as it building up higher high and to rise further, it need to break above the psychological level of 2,500.
Referring to the MACD histogram, a rounding top is forming up. As always, intraday support and resistance levels will be eyed.
Technical indicators
MACD= Positive, ADX= Positive,
Intraday Technical Support & Resistance for 28th Dec 2012

1st support 2,420; 2nd support 2,380-50
1st resistance 2,490; 2nd resistance 2,550-70
 
GOODLUCK

Wednesday, December 26, 2012

ZLBT's Random Stock Pick >>> Keladi Maju Bhd (6769)


KELADI (6769) has confirmed a bullish "Ascending Triangle" pattern with a 1.5 sen single-day advance to 21.5 sen.
 
Ascending triangles have a distinct bullish bias in that the chart pattern depicts the convergence of a horizontal resistance and an upward sloping support line as compared to the "Pennant" formation.
 
More importantly, the upside volatility breakout of the 20.5 sen resistance line on KELADI's daily chart marks a bullish continuation of an uptrend that extends as far back as a year. We reckon that the bullish move should carry the share price higher towards 24.5 sen in the coming weeks, and traders may consider buying in between 20.5 sen and the current 21.5 sen level.
 
Correspondingly, a stop-loss of 18.5 sen should also be placed.
 
Technical Ratings


Resistance 2 : RM0.23
Resistance 1 : RM0.22
Current Price : RM0.215
Support 1 : RM0.205
Support 2 : RM0.195
Action : Buy
 
GOODLUCK


ZLBT's Selective Overbought & Oversold Stocks >>> 24 Dec 2012

DISCLAIMER

The information contained herein was obtained from sources believed to be reliable. However, we do not guarantee the accuracy and completeness of the report. Opinions expressed herein are subject to change without notice. This report is for information purposes only and should not be construed as an invitation, offer or solicitation to purchase or sell any futures product referred to herein. The Author may from time to time has an interest or position in the futures products or stocks mentioned. There is a risk of loss in trading stocks,futures & derivatives like products.

Monday, December 24, 2012

Top 20 Overbought Stocks 24 Dec 2012

*Note: The list below is the 20 most overbought of the 1000 over Bursa Malaysia listed stocks with 14-day RSI above 80. It is generally a bearish or SELL list, especially if the readings approach 90.
 
Caveat: The list consists of fundamentally sound stocks, and hence are long-term BUY or HOLD stocks.

DISCLAIMER

The information contained herein was obtained from sources believed to be reliable. However, we do not guarantee the accuracy and completeness of the report. Opinions expressed herein are subject to change without notice. This report is for information purposes only and should not be construed as an invitation, offer or solicitation to purchase or sell any futures product referred to herein. The Author may from time to time has an interest or position in the futures products or stocks mentioned. There is a risk of loss in trading stocks,futures & derivatives like products.
 
GOODLUCK

Wednesday, December 19, 2012

FCPO 3rd Month >>> Commentary and Technical Analysis 19 Dec 2012

FCPO Daily Technical Analysis:
The FCPO active month contract ended lower on Tuesday as weak export data released by ITS and SGS remained weighed on the market sentiment. Moreover, uncertainty in the external markets also added some pressured. At the close, the FCPO price was down 8 pts to 2,342.


Based on the daily chart, an uncertain candle had been formed on Tuesday and during the trading session, the FCPO price went up to as high as 2355 but it failed to close above that level. Throughout the day, the price had lingered in a narrow range between 2,330 to 2,355. Our review remain unchanged, if the price fall further, the downside gap will be watched first and to rise further, it need to break and close above the level of 2,380.
Referring to the MACD indicator, MACD line crossed above the signal line where the bullish sentiment could be building up in the near term. As always, intraday support and resistance levels will be eyed.
Technical indicators:
MACD= Positive, ADX= Neutral,
 
Intraday Technical Support & Resistance for 19th Dec 2012:
1st support 2,300; 2nd support 2,285-2,250
1st resistance 2,350; 2nd resistance 2,380-2,400
 
GOODLUCK


FKLI >>> Analysis and Commentary 19122012


FKLI Daily Technical Analysis:
The FKLI spot month contract ended sharply higher on Tuesday, which had followed strong gains in cash market. Meanwhile, market also reacted positively on signs of progress in U.S. budget talks to avert the fiscal cliff. At the close, the FKLI price added 17.5 pts or 1.06% to 1,664.

Based on the daily chart, a long positive candle had been formed on Tuesday where it indicated that buyers were aggressive for the day. As we can see in the chart, the FKLI price successfully broke and closed above the previous high level at 1,657.5 which had triggered technical buying in FKLI market. Price regained its upward posture after it successfully stayed above the resistance turned support level (1,657.5). If the price is able to stay above the level of 1,657.5 in the coming days, the historical highest level will be watched.
Referring to the MACD indicator, the signal line is crossing above the central line. As always, intraday support and resistance levels will be eyed.
Technical indicators:

MACD = Positive, ADX= Positive
Intraday technical support & resistance for 19th Dec 2012:

1st support 1,657.5; 2nd support 1,650
1st resistance 1,672 2nd resistance 1,679
 
 
GOODLUCK

Tuesday, December 11, 2012

FCPO Daily technical analysis 11/12/2012

CPO BEARS STILL IN CONTROL
The FCPO active month contract ended slightly higher on Monday due to stock growth slower-than-expected and SGS released the export figure which showed Malaysia palm oil export rose 0.4% in the first ten days which had boosted sentiment. At the close, the FCPO price was up 16 pts to 2,313.
Based on the daily chart, a small positive candle formed on Monday where it indicated that mild buying interest supported the FCPO price. During the trading session, price went down to as low as 2,288 but it did not break below the previous low level at 2,280. As we can see in the chart, the price still trading above the uptrend support line and to rise further, it need to break and close above the range resistance level at 2,320.

Referring to the MACD indicator, MACD line crossed below the signal line where the bearish sentiment could be building up. As always, intraday support and resistance levels will be eyed.

Technical indicators

MACD= Negative ADX= Negative

Intraday technical support & resistance for 11th Dec2012
1st support 2,280; 2nd support 2,250-20

1st resistance 2,320; 2nd resistance 2,350
 
HAPPY TRADING

Monday, December 10, 2012

Technical Analysis : FBM KLCI 07-12-2012

Downward Momentum Easing-Off After 5 Weeks Selling Pressure.
The daily slow stochastic indicator for the KLCI climbed higher into more positive territory following last week’s mild recovery, while the weekly indicator showed lessening downward momentum. The 14-day Relative Strength Index (RSI) rose to an improved reading at 42.96 as of last Friday, while the 14-week RSI turned higher for a more positive reading of 48.20.

Immediate resistance for the index will be at 1,621, the 38.2% Fibonacci Retracement (FR) of
the uptrend from 1,526 low of 18 May to the record high of 1,679 on 29 October. The 100-day and 50-day moving averages, currently at 1,639 and 1,641, would act as stronger resistance levels. Immediate support would be at the 28 November pivot low of 1,590, while 1,585 and 1,563, the respective 61.8%FR and 76.4%FR, would act as better retracement supports.

HAPPY TRADING

Monday, December 3, 2012

ZLBT Random Stock Pick : Top 20 Overbought Stocks 03 Dec 2012

*Note: The list below is the 20 most overbought of the 1000 over Bursa Malaysia listed stocks with 14-day RSI above 80. It is generally a bearish or SELL list, especially if the readings approach 90.
Caveat: The list consists of fundamentally sound stocks, and hence are long-term
BUY or HOLD stocks.

DISCLAIMER

The information contained herein was obtained from sources believed to be reliable. However, we do not guarantee the accuracy and completeness of the report. Opinions expressed herein are subject to change without notice. This report is for information purposes only and should not be construed as an invitation, offer or solicitation to purchase or sell any futures product referred to herein. The Author may from time to time has an interest or position in the futures products or stocks mentioned. There is a risk of loss in trading stocks,futures & derivatives like products.
 
GOODLUCK

Monday, November 26, 2012

Technical Analysis : FBMKLCI 2012-11-26 / 富时大马综合指数 2012-11-26

FBM KLCI 2012-11-26
Despite the strong rebound of the US market on last Friday, the KLCI failed to rebound on Monday, but closing even lower. As indicated by A, the KLCI has been trending down in its short-term weakness movement for the 15th day now.
 
As indicated by B, total market volume remains below the 40-day Volume Moving Average, and this suggests that market participation is a little low, as investors are being very cautious amid the weakening market sentiment. Meanwhile, losers still outnumbering gainers on Monday with 447 losers versus 225 gainers. This shows that the selling pressure is still on the higher side.
 
As indicated by C, the Stochastic stays below 10%, which suggests that the short-term movement of the KLCI is indeed weak, but however, in over-sold condition.
 
In conclusion, despite the short-term over-sold condition, the KLCI has not even rebounded a little, and therefore, the immediate technical outlook for the KLCI is still on the negative side. Meanwhile, the KLCI is testing the 200-day Moving Average line, and if the KLCI should breach below this level, it would dampen the mid-to-longer term outlook for the KLCI.
 
富时大马综合指数 2012-11-26
尽管美国股市在上周五大幅回弹并重返200天移动平均线以上,综指不但未有反弹,而且还继续下跌。如图中箭头A所,综指已经连续15个交易日处于短期弱势中,同时目前正要试探200天的移动平均线。
 
如图中箭头B所示,马股总成交量还是处于40天的成交量平均线(VMA)以下,这除了表示市场交投量偏低以外,同时也暗示着投资者保持谨慎的态度。另外,周一全盘下的跌股项远远超越上升股(447只跌/225只涨),这显示着市场的卖压还是偏高的。
 
如图中箭头C所示,随机指标(Stochastic)目前还是处于10%的水平以下,这表示综指短期走势的确是处于疲弱的,同时也出现了超卖(Over-sold)的现象。
 
总的来说,虽然综指短期已经处于超卖的状况,但始终未能反弹,所以目前综指的技术展望还是处于负面的。接下来若综指跌破200天移动平均线的话,那将对综指中长期的技术展望带来负面的影响。
 
祝你好运


Saturday, November 24, 2012

24 Nov 2012 Dow Rally To Strong Weekly Gains


Dow Topples 13,000 On Black Friday
It was a solid day for the Dow Jones Industrial Average (DJIA), which ended near a session high to finish north of 13,000 for the first time since Nov. 6. With a lack of domestic data to go on, Wall Street spent the holiday-shortened trading day applauding upbeat reports from China and Germany. Investors also appear to be optimistic about the holiday shopping season, with most tech stocks and retailers gaining notable ground on the biggest shopping day of the year.

The Dow Jones Industrial Average (DJIA) blazed a steady path higher, adding 172.79 points, or 1.35%, to conquer the round-number 13,000 level. In addition, the blue-chip barometer ended atop its 200-day moving average for the first time in more than two weeks. All 30 of the index's components settled north of breakeven, led by Hewlett-Packard's (NASDAQ:HPQ) 4.2% advance. For the week, the Dow soared 3.3%.
 
Similarly, the S&P 500 Index (SPX) settled near a session high, tacking on 18.1 points, or 1.3%, to end atop the 1,400 level for the first time since Nov. 6. Meanwhile, the Nasdaq Composite (COMP) gained 40.3 points, or 1.4%. For the week, the SPX and COMP gained 3.6% and 4%, respectively.
 
GOODLUCK

Wednesday, November 21, 2012

FCPO Technical Chart and Commentary 21 Nov 2012

FCPO >>> From bearish recovery to bullish
2500 to be the turning point?
GOODLUCK

Saturday, November 17, 2012

FISCAL CLIFF POW-WOW >>> Dow gain on hopeful budget talk


DJIA down for a 4th consecutive week

U.S. stocks climbed Friday, denting weekly losses, as optimistic words followed the opening round of negotiations on averting automatic spending cuts and tax increases set to begin Jan. 1.

“It’s a distinct positive that they came out and said, ‘We talked, we saw some common ground.’ It’s not in either party’s interests to go over the cliff,” said Jim Dunigan, managing executive, investments, PNC Wealth Management, after congressional leaders emerged from the meeting with President Barack Obama and labeled the discussions “constructive.”

Halting a four-session losing run, the Dow Jones Industrial Average added 45.93 points, or 0.37%, to 12,588.31, leaving it with a 1.8% weekly loss.

The S&P 500 Index rose 6.55 points, or 0.48%, to 1,359.88, down 1.5% from the week-ago finish.

The Nasdaq Composite advanced 16.19 points, or 0.57%, to 2,853.13, off 1.8% for the week.

For every stock on the decline, nearly three rose on the New York Stock Exchange, where 949 million shares traded. Composite volume neared 4 billion.

GOODLUCK

Friday, November 16, 2012

Stop calling it a ‘fiscal cliff’

 
You’ve seen the scary headlines warning of an economic disaster heading our way. You’ve heard the overheated rhetoric, and seen fiscal countdown clocks, including one on this website.

It’s hogwash: The U.S. economy will not go over a “fiscal cliff” on Jan. 1, as we’ve been led to believe.

In truth, nothing much will happen to the economy on Jan. 1 or Jan. 2 or Jan. 3, despite the expiration of tax cuts and the automatic reductions in federal spending. For almost all of us, the first week of the new year will be much like the 52nd week of the old one.

The fiscal cliff is a misleading metaphor. The laws will change on that day, it’s true, but the impact will be spread out over many, many months. In fact, the effects are already being felt, particularly in financial markets. Businesses, investors, workers and consumers have begun to prepare for the changes, and that’s caused the economy to slow a bit already.


It’s not a Niagara Falls, with billions of gallons going over a cliff. It’s more like a bathtub slowly filling up. And, on Jan. 1, it’s going to spill over the edge. Eventually, it will flood the house, but that’ll take time.

It’s not an explosion; it’s water torture.

As far as the economy goes, the Jan. 1 deadline is meaningless. There’s no urgency to reach a deal quickly, no reason to abandon long-held principles just for the sake of meeting that deadline.


However, the politics are a very different story. The political pressure to appear reasonable could be so powerful that the two parties could reach a deal that they’ll come to regret. Just as they’ve come to regret their August 2011 deal, the one that created this year’s fiscal showdown.

To review, here’s what would change on Jan. 1:


• The Bush-era tax rates would expire. That would bring higher rates for ordinary income, capital gains, dividends, and estates.

• The annual patch in the alternative minimum tax would also expire, as would several small corporate tax breaks. These are always extended every year, and will almost certainly be extended again next year.

• The payroll tax holiday would end, which would mean a tax hike for every working American.

• Taxes to pay for Obamacare would hit the “rich.”

• On the spending side, about $100 billion in automatic cuts in federal spending would begin to be implemented, half in the defense budget and half in nondefense.

• Extended unemployment benefits would expire, cutting off benefit checks for about 3 million people. That’s going to hurt.

• Payments to doctors under Medicare would be cut, but these reductions have always been canceled in the past, and they will next year as well.


The immediate economic impact of these changes would be minor, although it would be negative. The expiration of the Bush tax cuts would be nearly imperceptible. In the event of a failure to reach a deal by the first of the year, it’s probable that the IRS would not change the tax withholding tables right away, so most of us wouldn’t see any impact in our paychecks until the taxes are due on April 15, 2014.

Maybe the countdown clock should say: “517 days” not 45.


The stock market might rally in January. Savvy investors would have sold in 2012 to lock in their capital gains to guarantee the lower tax rate, and once the calendar turned, they’d be ready to swoop in to catch some bargains.

The spending cuts would be implemented immediately, but the impact on the economy would be gradually felt, with the vast majority of federal spending continuing as before.
 
 
Contracts that were already obligated would not be affected. Some federal workers (and private-sector workers) would certainly be furloughed, and plans to buy new equipment or maintain old equipment would be postponed. Over time, these cutbacks would begin to hurt the broader economy.

The only components of the fiscal cliff that would have an immediate impact are the parts that are certain to go into effect, no matter what kind of deal is reached: The end of the payroll tax holiday and the expiration of extended jobless benefits.

The increase in the payroll tax (also known as FICA) would be, as President Barack Obama said in 2011, “a big deal.” It would mean $40 less in their paycheck every week.

Just because the impact wouldn’t be instantaneous doesn’t mean it wouldn’t be significant, if it persisted for a full year. The Congressional Budget Office predicts that, if Congress does nothing, the economy would fall back into a recession in the first half of 2013 as the deficit reduction kicks in.

Millions of people would lose their jobs, many businesses would fail and the nation would endure more economic hardship, according to the CBO and many private economic analysts.

That is, if Congress did nothing and left the higher taxes and lower spending in place for a full year. Congress could step in at any time, before or after Jan. 1, to postpone the deficit reduction.

If Congress doesn’t act by the middle of February or so, the austerity will weigh heavier and heavier on the economy with each passing week as the unemployment rate climbs higher and higher.

And that’s when the pressure to cut a deal will be unbearable. When the water from the tub starts flowing into the living room.


 GOODLUCK

Saturday, November 10, 2012

WALL STREET 10 Nov 2012 >>> 'Cliff' Fears Give Stocks Worst Week Since June

DJIA edge up but post heavy weekly losses
Dow, S&P suffered worst week in 5 months
Despite a small advance on Friday, stocks ended up having their worst week since June as investors moved on from Tuesday's election and worried about the impending US "Fiscal Cliff."

For the week, the Dow fell 2.1 percent, while the S&P 500 lost 2.4 percent and the Nasdaq dropped 2.6 percent since President Barack Obama won re-election on Tuesday, the market is down well over three percent.


On Friday, stocks lost most of their earlier gains after Obama called for higher taxes on the rich.
After a choppy trading session, the Dow Jones Industrial Average 
rose 4.07 points, or 0.03%, to end at 12,815.39, but it dropped 2.1% for the week. This was Dow’s third consecutive week of losses.
 
The S&P 500 climbed 2.34 points, or 0.2%, to end at 1,379.85, but it declined 2.4% for the week. Technology led sector gains Friday, while utilities performed most poorly among the 10 industry groups.
 
The Nasdaq Composite added 9.29 points, or 0.3%, to end at 2,904.87, but it dropped 2.6% for the week, posting its fifth consecutive week of losses.

The CBOE Market Volatility Index (VIX) moved modestly higher amid continued trepidation among investors. While staying south of the $19 level, the VIX added close to 0.7% on the day and finished the week 5.8% higher.

Around 740 million shares traded on the New York Stock Exchange. Composite volume topped 3.6 billion.

Friday, November 9, 2012

09 Nov 2012 >>> Astro Shares Continue Slide


ASTRO 11.7% Lower Than IPO RM3
Shares of Astro drifted to its lowest closing price yesterday since its re-listing three weeks ago as even as speculation swirls over who the sellers are Astro closed down three sen at RM2 65 and is now down 11 7 per cent from its initial public offering IPO price of RM3. There have been no announcements of selling by major shareholders so far leading some market observers to suspect that the selling pressure could be coming from Astro employees themselves who took out financing in order to buy shares of Astro and who cannot meet the margin calls as the share price kept dropping resulting in automatic sell orders
.

It was reported by The Star that Astro management met with their staff over the disappointing share price performance and efforts were being made to get the financing banks to give more time before making margin calls or to lower the margin threshold for Astro employees. Analysts and brokers said that the selling pressure could possibly also be due to a combination of other factors including an unsustainable price premium given the lack of dividend yield as well as foreigners exiting the market especially telecommunication stocks.
 
One analyst said that Astro s incumbent position and monopoly on satellite TV gave it a premium price upon listing which could also mean a limited upside and investors could be shifting their money to where they perceived they could get better yields.  “Investors might just be biting the bullet and shifting their money elsewhere ” said the analyst. One broker said that those who took out margin financing to buy Astro shares could be hitting their cut loss thresholds.
 
“If the buyers who took margin financing can't top up the difference their bankers will auto sell”  said the broker He also said that foreigners have been taking profit and reallocating their assets outside the country “When they cut, they cut everything ” the broker noted.

Astro has been the weakest of the major IPOs in Kuala Lumpur this year although it secured 22 cornerstone investors including US hedge fund Och-Ziff Capital Management. The weakness in the share price could also be due to a change in rules also allowed the cornerstone investors to exit Malaysia’s largest pay-TV operator without a lock-up period Malaysia’s pension fund giant Employees Provident Fund EPF did not invest in the company possibly because it did not find the dividends expected to be between 2-3 per cent attractive enough.

Astro started in 1996 just before the Asian financial crisis It was listed on Bursa Malaysia in 2003 as Astro All Asia Networks AAAN but delisted in June 2010 after its major owners Ananda Krishnan and Khazanah Nasional decided to take it private. The rationale for de-listing was losses from its overseas operations — India and Indonesia. Both operations required more capital and gestation which would have impacted Astro’s bottomline if it had stayed listed. Two years have passed and it is back on Bursa as AMH Astro Malaysia Holdings with Ananda Krishnan holding about 50 per cent and Khazanah holding 20.8 per cent.
 
Some analysts said however that Malaysia’s largest pay-TV operator is poised for robust growth thanks to the country’s low pay-TV penetration rate rising income levels and its large content offerings. MIDF Research said that Astro’s average revenue per user ARPU is expected to be maintained due to rising household income and upgrading of subscribers and that its stated 75 per cent payout ratio would make it a good defensive stock to hold.

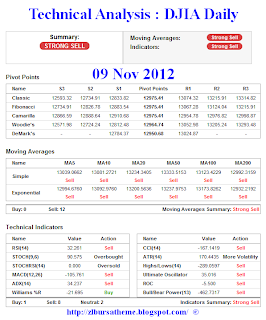
09 Nov 2012 >>> DJIA Falling down, falling down, falling down

Wall Street In Multi-Day Retreat
The markets took heavy losses for a second day in a row Thursday in a broad-based retreat late in the session. Every major sector closed to the downside. 
The Dow Jones Industrial Average fell 121.41 points, or 0.94%, to 12,811.32,
its lowest close since late July.
The technicals data is not pretty. In fact it is looking horribly ugly.
 
GOODLUCK

Technical Analysis : FBM KLCI 2012-11-08 / 富时大马综合指数 2012-11-08

FBM KLCI 2012-11-08
Due to the over-night sharp losses of the US markets, plus the Asian markets were also falling, and the KLCI was not exempted. The KLCI had its intra-day low touching 1637.50 points, but at late trading, the KLCI started to rebound, closing at 1641.07 points or a loss of 4.46 points, forming a long lower-shadow candlestick. Generally, this implies that the KLCI is likely to have some rebound.
 
As indicated by B, total market volume fell 17.16%, with volume slightly below the 40-day Volume Moving Average. Generally, when the market overall is falling, lower volume is normal as investors are being cautious while reluctantly taking up new positions.
 
As indicated by C, the Stochastic stays below 30%, thus suggesting that the short-term movement of the KLCI is still weak. If the Stochastic should break above 30%, it would be a signals suggesting a short-term technical rebound for the KLCI.
 
In conclusion, after falling for 5 consecutive days, the KLCI is showing a sign of a possible rebound. Also, many blue chips counters are trading at their short-term over-sold condition, and this could attract some bargain buying interests, thus it may increase the chance of some rebound in the KLCI.
 

富时大马综合指数 2012-11-08
由于隔夜美国股市猛挫,再加上亚太区域股市满盘皆输,综指也难豁免,盘中一度下跌至1637.50点的最低点,惟在最后交易时段回弹,才收复了大部分的失地,综指最后以1641.07点挂收,按日下跌了4.46点。如图中箭头A所示,综指反弹后留下来一条偏长的下影线(Lower-Shadow),这在阴阳烛图分析里通常暗示着有回弹的迹象。
 
如图中箭头B所示,马股总成交量减少了17.16%,这使到成交量稍微处于40天的成交量平均线(VMA)的水平以下。一般来说,当综指(或市场整体上)下跌时,成交量减少是很正常的,这是因为投资者处于谨慎,暂时在场外观望所致。
 
如图中箭头C所示,随机指标(Stochastic)继续处于30%水平以下,这表示综指短期走势还是处于偏弱的格局。接下来若随机指标能上扬突破30% 水平的话,那便是综指短期出现技术反弹的讯号。
 
总的来说,综指连续下跌了整整5日,如今已经呈现了一条偏长的下影线,再加上许多蓝筹股项都出现了短期超卖(Over-sold)的现象,特别是最近下跌最严重的电讯股,这可能会引来一些趁低买入的购兴,同时有助于增加综指出现技术反弹的可能。
 
祝你好运