ZLBT Chats

Showing posts with label MACD. Show all posts

Monday, July 15, 2013

FKLI Preview, Tecknical Outlook 15 July 2013

FKLI Daily technical analysis
The FKLI spot month contract ended slightly higher on Friday which was in tandem with the rise in benchmark index. At the close, the FKLI price up 1.5 points or 0.08 % to 1,789.5.
Based on the daily chart, a small positive candle with lower wick has been formed on Friday where it indicated that the FKLI price was supported at the intraday low level. As we can see in the chart, the price traded in a narrow range after it rose sharply on Thursday. However, the price still managed to stay above the support line for second day. The FKLI price may rise further if it is able to stay above the support line in the coming days.
Referring to the MACD histogram, rounding bottom is forming up. As always, intraday support and resistance levels will be eyed.
Technical indicators
 
MACD= Positive, ADX= Positive
Intraday technical support & resistance for 15th July 2013
 
1st support 1,785; 2nd support 1,780-75
1st resistance 1,793, 2nd resistance 1,800

GOOD LUCK

Friday, July 5, 2013

FBM KLCI Futures >>> Daily Preview, Technical Analysis

Preview
 
Expect futures to trade range bound with an upward bias in tandem with rising Asian and European markets after European policy makers communicated that they will maintain interest rates at a record low for an extended period of time to stimulate further growth. US market was closed last night in conjunction with the Independence Day holiday. Jobless claims figures due to release later tonight will be closely watched for indication of economic strength.

In the local front, FBM KLCI gained 0.12 points to settle at 1771.34. The local index managed to post some gains in tandem with advances in most global markets, albeit lackluster trades.

Leading leaders were stocks from the plantation and banking industries, namely Kuala Lumpur Kepong, IOI Corp, CIMB, Maybank, Public Bank, and Hong Leong Bank. Futures now trade at a further premium of approximately 4 points away its underlying cash index.

Technicals
Futures prices hiked 0.31 percent to close at 1775.50. Trading activities formed a white spinning top, a depiction of indecisiveness amongst investors. Regardless, prices still managed to close firmly above its 20, 50, and 100 day moving averages, which imply that strength was still in tact. Hence, expect prices to further its bullish movement today as MACD indicator pointed towards a buy strategy as well.

Support and resistance can be eyed at 1765 and 1785 respectively.


Strategy
Traders may long with a stop on or below 1765.

Monday, May 27, 2013

FCPO >>> Commentary and Technical Analysis 27 May 2013


FCPO Daily technical analysis:
The FCPO active month contract managed to end in the positive territory after it swung between gains and losses on Thursday. At the close, the FCPO price added 11 pts or 0.47% to 2,370.

A white candle with long lower shadow was formed as prices traded lower but were lifted by aggressive buyers in late trading hours to erase losses and finished at near intraday
high. Prices closed firm above 20 and 50 day moving averages, a sign of the domination of bulls in the market. MACD also supports the bullish trend signal by staying on its bullish journey and rising steadily. As such support and resistance can be pegged at 2342 and 2400 respectively.

Based on the daily chart, a positive candle with long lower wick has been formed on Thursday where it indicated the FCPO price was supported at the intraday low level.

During the trading session, the FCPO fell to as low as 2,342 due to uncertainty in the external markets which weighed on the market sentiment. As we can see in the chart, the price is unable to break above the level of 2,380 on Thursday. To rise further, it needs to break and closes above that mentioned level.

Referring to the MACD histogram, it is building up in the positive zone. As always, intraday support and resistance levels will be eyed.

Technical indicators:
MACD= Positive, ADX= Positive,

Intraday technical support & resistance for 27th May 2013:
1st support 2,342; 2nd support 2,330-00
1st resistance 2,380-90; 2nd resistance 2,400-15

Strategy
Trade may long with a stop on or below 2342.

Thursday, May 23, 2013

FKLI >>> Technical Outlook 23 May 2013


Technicals
Expect futures prices to succumb to further profit taking today ahead of the extended weekend. BSKL will be closed for Wesak Day on Friday.

Futures prices cascaded 0.64 percent, closing at 1776. Trading activities formed a black candle with long upper shadow, implying that
gains posted in the earlier trading session were not sustained. This formed a bearish harami which indicates further downward potential.

The downward price movements managed to bring RSI indicators down from a previously overbought situation.

Additionally, MACD indicators is currently neutral, a signal that bullish momentum is waning. As such, range for the day can be eyed at 1760 and 1785 respectively.

Intraday technical support & resistance for 23rd May 2013:
 1st support 1,770; 2nd support 1,765-60
 1st resistance 1,785, 2nd resistance 1,796-1800

Strategy
Trade may short with a stop on or above 1785.

GOOD LUCK 

Wednesday, April 17, 2013

FCPO : Technical Analysis 17 Apr 2013


FCPO Daily Technical Analysis
 The FCPO active month contract ended off low on Tuesday due to electronic soybean oil prices traded sharply higher during the Asian trading session had supported the FCPO price. At the close, the FCPO price was flat at 2,301.

 Based on the daily chart, a small positive candle has been formed on Tuesday where it indicated that buying interest emerged at the intraday low level. During the trading session, the FCPO price had tested the intraday first support level but it did not break below that level. If the price is able to stay above this level in the coming days, there is a high possibility it may rise further.

 Referring to the MACD histogram, it is building up in the negative zone. As always, intraday support and resistance levels will be eyed.


Technical indicators:
 MACD= Negative, ADX= Negative


Intraday technical support & resistance for 17/04/2013
 1st support 2,285; 2nd support 2,228-15
 1st resistance 2,340; 2nd resistance 2,380

Recommendations
Sell Into any Rebound High 

Monday, April 8, 2013

CPO Analysis For The Week Ahead 08 Apr 2013


CPO Technical Outlook
The benchmark June contract was consolidating this week and some trad­ers were cautious ahead of key fundamental reports and preferred to stay on the side-lines.
Last week’s palm oil price movement showed that the market was directionless while waiting for the fun­damental reports next week to gauge on the next price movement.
The benchmark level of RM2,360 will continue to be monitored to determine if the palm oil prices could be supported at this level.
Any price break below RM2,340 would attract more technical selling and long liquidation in the market.
Resistance would be pegged at RM2,430 while support will be set at RM2,340.
In addition, the increase worries on the bird flu outbreak in China also con­tributed the fall in soybean prices which could reduce the demand in feeds. 


Recommendations 
Sell Into Strength 

Tuesday, April 2, 2013

FKLI Spot >>> Technicals & Commentary 02 Apr 2013


FKLI Daily Technical Analysis
The FKLI spot month contract ended off low and it managed to close in positive territory on Monday. Meanwhile, cash market closed down 4 pts to end at 1,667.6 points. At the close, the FKLI price was up 3 pts or 0.18% at 1,664.5.

Based on the daily chart, a small negative candle with long lower wick has been formed on Monday where it indicated that price was supported at the intraday lowest level. During the trading session, the FKLI price fell to as low as 1,652 where it hit the 38.2% of Fibonacci level but later it managed to bounce up and closed near the intraday highest level. As we can see in the chart, the FKLI price currently consolidating in a narrow range and we should monitor closely what type of formation it will form in the near term.

Referring to the MACD histogram, rounding top is forming up in the near term. As always, intraday support and resistance levels will be eyed.

Technical Indicators
MACD= Positive, ADX= Positive,


Intraday Technical Support & Resistance for 2/42013
1st support 1,652; 2nd support 1,643
1st resistance 1,678-82, 2nd resistance 1,690

Friday, March 29, 2013

FKLI Spot >>> Commentary c/w Daily Chart


FKLI Daily technical analysis
The FKLI spot month contract ended with limited losses on Thursday while cash market managed to close in the positive territory. At the close, the FKLI price was dropped 2.5 pts or -0.15% to 1,673.

Based on the daily chart, an uncertain candle has been formed on Thursday where it indicated that market was indecisive. As we can see in the chart, a reversal candle formation had detected at the current highest level. Normally this kind of candle formation suggests that the FKLI price may reverse from the current highest level. However, further confirmation is needed to confirm the signal.

Referring to the MACD histogram is building up in the positive zone. As always, intraday support and resistance levels will be eyed.

Technical indicators
MACD= Negative, ADX= Negative,

Intraday technical support & resistance for 29th Mar 2013
1st support 1,660; 2nd support 1,650
1st resistance 1,678-82, 2nd resistance 1,690


GOOD LUCK 

Tuesday, January 29, 2013

FCPO >>> Trading Only When BREAKOUT, North or South

Can It Gets Any Simpler Than This???

FCPO Daily technical analysis: The FCPO active month contract ended lower on Friday due to bad export figures released by ITS and SGS which had weighed on the market sentiment. Moreover, investors also booked some of their profits ahead of long weekend. At the close, the FCPO price dropped 36 pts to 2,445.

Based on the daily chart, a negative candle had been formed on Friday where it indicated price had been pressured throughout the day. As we can see in the chart, the FCPO price had retreated after it had failed to break above the resistance line as drawn in the chart. To rise further, it needs to break and stay above the resistance line. Otherwise, it may fall back.

Referring to the MACD histogram, it is building in the positive zone. As always, intraday support and resistance levels will be eyed.

Technical Indicators:
MACD= Positive, ADX= Positive,

Intraday Technical Support & Resistance for 29th Jan 2013:
1st support 2,430; 2nd support 2,404-2377
1st resistance 2,488; 2nd resistance 2,525-50

GOODLUCK2ALL

Saturday, January 19, 2013

WALL STREET : Bulls Win a Third Straight Week


Dow, S&P 500 end at five-year highs on early earnings beats

"In a relatively uneventful day, the markets caught their breath after yesterday's strong rally," summarized a Senior Equity Analyst. The Dow Jones Industrial Average (DJIA) broke higher in the afternoon after a sluggish start, closing the session at its highest point since December 2007.

"Meanwhile, the CBOE Market Volatility Index (VIX) dropped to its lowest level since June 2007," noted another analyst, "as investors continued to bid the market higher as the week drew to an end." 


On Wall Street, the Dow Jones Industrial Average 
gained 53.68 points, or 0.39%, to end at 13,649.70; it rose 1.2% for the week.

Leading gains on the Dow, General Electric shares
 climbed 3.5% after its earnings beat estimates.

TECHNICAL ANALYSIS DJIA 19 JAN 2013

The Dow close higher on Friday as it extends the rally off November's high. The high-range close sets the stage for a steady to higher opening on Tuesday. Stochastics and the RSI are overbought but remain neutral to bullish signaling that sideways to higher prices are possible near-term. If the Dow extends the rally off November's low, October's high crossing at 13,661 is the next upside target. Closes below the 20-day moving average crossing at 13,349 are needed to confirm that a short-term top has been posted.

First resistance is today's high crossing at 13,649.
Second resistance is October's high crossing at 13,661.
First support is the 10-day moving average crossing at 13,486.
Second support is the 20-day moving average crossing at 13,349.


HAPPY WEEKEND

Thursday, January 10, 2013

FKLI Daily Market Commentary 10 Jan 2013


FKLI Daily Technical Analysis
The FKLI spot month contract rebounded further and it closed in the positive territory on Wednesday, followed the gains in cash market. At the close, the FKLI price gained 8 pts or 0.47% to 1,697.

Based on the daily chart, a positive candle with upper wick had formed on Wednesday where it indicated that mild profit taking emerged at the intraday high level. 

As we can see in the chart, the second candle formed on Wednesday had successfully broke above the resistance line and now it turned as support line. We should monitor closely the change of the trend in the coming days

Referring to the MACD histogram, rounding top is forming up. As always, intraday support and resistance levels will be eyed.

Technical indicators

MACD= Positive, ADX= Positive

Intraday technical support & resistance for 10th Jan 2013

1st support 1,689; 2nd support 1,680
1st resistance 1,705, 2nd resistance 1,712

GOODLUCK

Tuesday, January 8, 2013

Lower liners on the move ...... The FBM Small Cap Daily Chart 08 Jan 2013


LITTLE FELLAS MAKING BIG MOVES
In stark contrast to the FBM KLCI related bluechips, we are seeing a notable shift to second-third liners as investors adopt a 'risk on' approach to investing in the local bourse. As a guage, the FBM Small Cap (which comprises of the top 98% of the Bursa Malaysia Main Board) has advanced over 500 points from its 11,1361.30 low in December.
Yesterday, the FBM Small Cap rose 1.5% or 183.68 points to settle at 11,920.19. In fact, the broad market index broke above the crucial down-trend resistance, and we believe that a major bullish reversal may be at hand. Trading volumes have also picked up in recent days, while the MACD is indicative of a gradual shift in momentum from bearish to bullish. To that respect, we believe improved broad market sentiment should be a boon for small cap traders in the days and weeks to come.

GOODLUCK

Friday, December 28, 2012

FCPO Daily Technical Analysis 28 Dec 2012

The FCPO active month contract ended sharply higher on Thursday, due to electronic soybean oil prices traded higher which had boosted the local market sentiment. At the close, the FCPO price had added 49 pts to 2,479.

Based on the daily chart, a long positive candle had formed on Thursday where it indicated that buyers were aggressive throughout the day.  During the trading sessions, the FCPO price went up to as high as 2,484 where the upside gap nearly covered. As we can see in the chart, the trend is positive as it building up higher high and to rise further, it need to break above the psychological level of 2,500.
Referring to the MACD histogram, a rounding top is forming up. As always, intraday support and resistance levels will be eyed.
Technical indicators
MACD= Positive, ADX= Positive,
Intraday Technical Support & Resistance for 28th Dec 2012

1st support 2,420; 2nd support 2,380-50
1st resistance 2,490; 2nd resistance 2,550-70
 
GOODLUCK

Friday, November 9, 2012

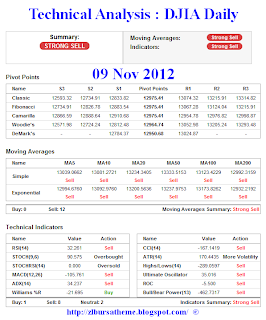
09 Nov 2012 >>> DJIA Falling down, falling down, falling down

Wall Street In Multi-Day Retreat
The markets took heavy losses for a second day in a row Thursday in a broad-based retreat late in the session. Every major sector closed to the downside. 
The Dow Jones Industrial Average fell 121.41 points, or 0.94%, to 12,811.32,
its lowest close since late July.
The technicals data is not pretty. In fact it is looking horribly ugly.
 
GOODLUCK

Friday, November 2, 2012

02 Nov 2012 Wall Street Rallys on Job News

GOOD START TO NOVEMBER: The Dow Jones industrial average rose 136.16 points  (+1.04%) on the first day of November, its best gain since mid-September. That came after a loss in October, the first down month since May.

CONFIDENT CONSUMERS: The Conference Board said Americans' confidence in the economy surged last month to the highest level in nearly five years. Many were encouraged by an improving job market.

JOBS NEWS: Investors got a twin dose of good news on the jobs market. Claims for unemployment benefits fell last week, and payroll processor ADP reported that private companies added more jobs last month than economists had been expecting.


HAPPY TRENDING

Thursday, October 25, 2012

ZLBT Random Stock Pick 25 Oct 2012 >>> DBHD (3484)

GE 13 Short-term Trade
DBHD (3484)
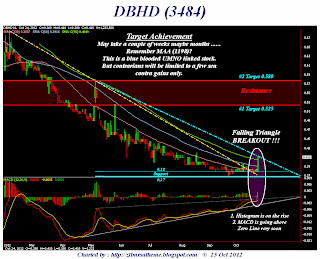
Chart Analysis
An important development took place on 24 October 2012 where the price of DBHD broke the resistance of 0.39. This breakout was accompanied by a higher than average traded volume which shows the enthusiasm of the traders to push the price higher and past this resistance hence giving a higher probability of a successful breakout. DBHD close 0.41 with a +0.025 gain on increased volume.
 
Recommend BUY ON WEAKNESS (Red prices only)
Cutloss 0.38 > 0.37
Target : 0.525 & 0.580
 
GOODLUCK

Thursday, October 18, 2012

FCPO Commentaries and Technical Analysis 18 Oct 2012

FCPO Daily Commentary & Technical Analysis
The FCPO active month contract ended slightly higher on Wednesday as electronic soybean oil prices traded higher during the Asian trading session which had underpinned the FCPO price. At the close, the FCPO price was up 5 pts or 0.20% to 2,471.
Based on the daily chart, the FCPO price traded in a narrow range on Wednesday and it had formed a small negative candle. As we can see in the chart, the trend is still positive as long as the FCPO price is able to stay above the level of 2,360. On the other hand, the price could linger in between the range of 2360-2529 and to rise further, it need to break and closes above the level of 2530.
Referring to the MACD histogram, it is building up in the positive zone. Meanwhile, MACD line is crossing above the signal line where the positive sentiment could be building up. As always, intraday support and resistance levels will be eyed.
Technical indicators
MACD= Positive, ADX= Negative

Intraday technical support & resistance for 18th Oct 2012


1st support 2440-2400; 2nd support 2360
1st resistance 2530; 2nd resistance 2575

GOODLUCK

Monday, October 1, 2012

FKLI Daily Market Commentary >>> FKLI


FKLI Daily Technical Analysis
The FKLI spot month contract expired unchanged but the benchmark index closed solidly higher due to market sentiment lifted from the 2013 Budget announced on Friday. At the close, the FKLI price was unchanged to 1,633.5.
As we can see in the chart above, the FKLI price had tested the resistance line as drawn in the chart but it failed to break above the resistance line. However, we should monitor closely if the price is able to break and closes above the resistance line, it will rise further and the previous high level will be monitored. Otherwise, it will fall back if the price is unable to break above the resistance line.
Referring to the MACD indicator, the MACD line just crosses above the signal line where the positive sentiment may be building up. Meanwhile, MACD histogram just building up in the positive zone. As always, intraday support and resistance levels will be eyed.
Technical indicators:

MACD =  Negative, ADX=Negative
Intraday technical support & resistance for 01 st Oct 2012

1st support 1,628; 2nd support 1,620
1st resistance 1,638-45; 2nd resistance 1,652
 
GOODLUCK2ALL

Thursday, September 27, 2012

FKLI closes 15.5 points higher @1633.5 >>> 27 Sept 2012

FKLI Moves Into Premium

Don't Be A Stubborn Trader
As human, we have different personality traits and each can be good or bad to us. As a trader, it is important to have the capability to overcome your ‘bad’ personality traits and don’t let them influence your decisions. One such personality trait is stubbornness.
 
HAPPY TRENDING

Tuesday, September 18, 2012

Technicalities FBM KLCI 18 Sept 2012 >>> Tough to Crack 1,655 Record High


Strong rebound last week reverse the recent sell-off from a fresh three month low
Week-on-week, the benchmark FTSE Bursa Malaysia Kuala Lumpur Composite Index (FBM KLCI) gained 18.4 points, or 1.13% to 1,642.95. Average daily traded volume and value shrank to 946.5 million shares and RM1.7 billion, compared to the 1.33 billion shares and RM1.7 billion average the previous week.
FKLI Spot month September KLCI futures contract traded on the Bursa Malaysia Derivatives Berhad climbed 23.5 points or 1.46% last week to 1,638.5, reducing the discount to the cash index to 4.45 points, compared to the 9.55-point discount the previous week, as the futures market undertone stayed cautious despite the strong rebound.
 
The daily slow stochastic indicator for the FBM KLCI has climbed into the neutral zone after
triggering a buy signal last week (Chart 1), but the weekly indicator hooked down from the
overbought region following the previous week’s sell signal. The 14-day Relative Strength Index
(RSI) recovered to a more bullish reading at 54.99, while the 14-week RSI hooked up for a reading at 61.09 as of last Friday.

The daily Moving Average Convergence Divergence (MACD) trend indicator’s trigger line has
turned upwards, signaling improving upside momentum, but the weekly MACD just flashed a sell signal (Chart 2). Meantime, the +DI and –DI lines on the 14-day Directional Movement Index (DMI) trend indicator are contracting towards each other, poised to reverse last week’s bearish signal.
 
Conclusion
Despite the strong rebound seen on blue chips late last week, the weaker than usual buying momentum and discount on the futures market implies upward momentum could stall as the index climbs higher towards the record high, as market undertone remained cautious. While short-term technical momentum has turned positive, note that weekly indicators remained bearish given the sell signals on weekly stochastics and MACD indicators.
Hence, it would be challenging for the index to overcome the 1,655.49 record peak of 3 Sept this
week (Chart 3), unless buying momentum and external sentiment improves further. In any case, higher upside hurdles upon a breakout would be at 1,660 and 1,672, the respective 1.618 and 1.764 Fibonacci Projection targets of the 1,609 high of 3 April to the 1,526 low of 18 May, with 1,691 as the one-to-one projection target. Immediate support is revised upwards to 1,636, the 50-day moving average, followed by 1,609, the 3 April peak, with better support at 1,591, which is the 50% retracement of the run-up from 1,526.6 low on 18 May to the 1,655.49 peak of 3 Sept.

HAPPY TRENDING