ZLBT Chats

Thursday, March 31, 2011

ZLBT Random Stock Pick >>> SUNCITY (6289)

Please click on image to ENLARGE
DISCLAIMER
The information contained herein was obtained from sources believed to be reliable. However, we do not guarantee the accuracy and completeness of the report. Opinions expressed herein are subject to change without notice. This report is for information purposes only and should not be construed as an invitation, offer or solicitation to purchase or sell any futures product referred to herein. The Author may from time to time has an interest or position in the futures products or stocks mentioned. There is a risk of loss in trading stocks,futures & derivatives like products.
HAPPY TRADING & GOODLUCK2ALL

ZLBT Morning Views >>> Wall Street nears multi year high

WALL STREET : The DJIA @ 6-week High ; Topples 12,300
SPX & NASDAQ both finished 0.7% higher
Stocks catapulted higher right out of the gate today, as investors celebrated the latest round of deal-making and encouraging employment data. More notably, though, Automatic Data Processing (ADP) said the private sector added 201,000 jobs in March -- in line with expectations, and prompting a collective sigh of relief ahead of Friday's closely watched payrolls report.

"This is a strong report that indicates continued momentum in the pace of labor market recovery," wrote an economist in a research note.

As the bullish stars aligned, the Dow Jones Industrial Average approached multi-year highs, with all three major market indexes ending comfortably north of breakeven.

One analyst said what’s known as “window dressing” by portfolio managers, an attempt to improve the appearance of quarterly statements by adding to certain investments, also helped.
QUOTE : Portfolio Fund Manager
“The upside pressure on the market is mainly due to the need to reduce cash before the end of the quarter,”

After coming within 8 points of new-high territory, the Dow Jones Industrial Average (DJIA – 12,350.61) lost some steam in the final minutes of trading, but still ended on a respectable gain of 71.6 points, or 0.6%. What's more, the blue-chip barometer ended north of 12,300 for the first time since Feb. 18, as all but four of its 30 components settled in the black.

The S&P 500 Index (SPX – 1,328.26) ended with a gain of 8.8 points, or 0.7%, notching its first finish atop the 1,320 level since March 9. However, the broad-market barometer retreated in the face of the 1,330 level, which has been conquered just once on a daily closing basis since Feb. 18. Finally, the Nasdaq Composite (COMP – 2,776.79) ended with a similar gain of 19.9 points, or 0.7%, but ran into a wall in the 2,780 level. However, the tech-rich COMP is now on pace to end the week atop its 10-week trendline for the first time in almost a month.

Stocks have bounced back markedly from the slump triggered by fears over the situation in Japan, the Middle East and North Africa. Indeed, the Dow has soared 737 points, or 6.4%, since bottoming on March 16.

TECHNICAL ANALYSIS
Dow Jones Industrial Average
The Dow closed higher on Wednesday as it extends the rally off March's low. This morning's jobs report indicated that the US economy added 201,000 jobs to the private sector this month. That added to optimism in the equity markets as it extended the rally off March's low but fell short of testing February's high crossing at 12,391. Investors are still worrying about the long-term implications of Japan's earthquake, tsunami and nuclear crisis, as well as increasing social unrest in the Middle East and rising debt concerns in Europe. Nevertheless, the high-range close sets the stage for a steady to higher opening on Thursday. Stochastics and the RSI are overbought but remain bullish signaling that sideways to higher prices are possible near-term. If the Dow extends the aforementioned rally, February's high crossing at 12,391 is the next upside target. Closes below the 20-day moving average crossing at 12,027 are needed to confirm that a short-term low has been posted.
First resistance is today's high crossing at 12,383.
Second resistance is February's high crossing at 12,391.
First support is the 10-day moving average crossing at 12,101.
Second support is the 20-day moving average crossing at 12,072.
HAPPY TRADING

Malaysia Derivatives Exchange >>> THE FKLI

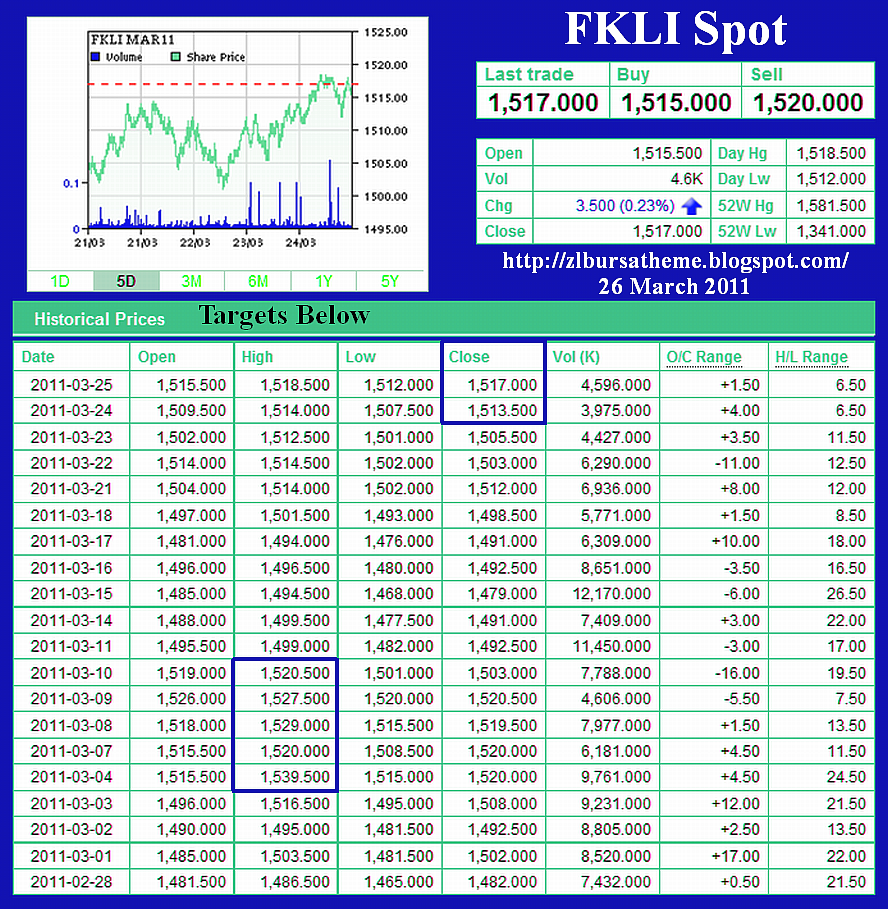
OPTIMISTIC APRIL AWAITS THE FKLI
 FKLI March (Spot) contract expected to expire on a strong note in tandem with the firmer cash market.
Technically, the FKLI Spot Daily Chart below have taken out the Bollinger Middle Band and Fibonacci Retracement 50% Resistances. During this change in polarity principles both the
FR 50% & Mid BB have now turned from resistances to supports.
With the FKLI prices positioned above the Mid BB coupled with expanding Bollinger Bands, the uptrend is seen to be strengthening. Positive sentiments are supported by the MACD rising above the Zero Line. Histogram is in Round Top formation.
With the Stochastics above the 70% level, the FKLI uptrend is expected to stay intact until the Stochastics should fall below 70% whereby consolidations is expected to set in. 
 FKLI 15 mins Chart Bull Flag
The BF like the Bull Pennant are continuation patterns.
In a nutshell, a bull flag appears as a bunch of candles (5 or more) that dips or moves sideway during a major uptrend. This happens with lower volume that began at the mast or flagpole and to continue until a breakout occurs where prices are boosted by stronger than average volume.
Many technical analysts are of the opinion a flag is necessary break for the bulls to "take a breather" after a strong uptrend. It can also be viewed as a consolidated "cooling-off" period for bulls to catch a 2nd wind.
REMINDER
Bull Flags & Pennants are more consistent and telling during DAILY CHARTS. Since ZL is using a 15 mins short timeframe period as an example above, readers are cautioned that a breakdown can happen as fast as the breakout that occurs.
Anyway, an example is better than no example.
It is just to exemplify the mechanism & characteristics of the mentioned pattern.
Cautions & Alerts OK?

HAPPY TRADING & GOODLUCK2ALL

Wednesday, March 30, 2011

TECHNICAL ANALYSIS : 综合指数 2011年03月30日 / FBMKLCI 30/03/2011

综合指数 2011年 03月 30日
如图中箭头A所示,综指周三跳空上扬,按日上扬11.54点或0.76%。综指成功的上扬突破1525点的费氏阻力线,因此1525点的费氏线将是综指第一道支持水平。另外,14、21、31天综合加权移动平均线(Exponential Moving Average - EMA)依然是综指当前上扬的动态支持线。综指接下来要的阻力水平落在1537点的费氏线。

如图中箭头B所示,马股总成交量增加33.14%,继续保持在40天的成交量平均线(VMA)以上。这表示当前市场买盘继续增加,因此有足够的承接力来吸纳离场的卖压。足够的成交量是综指(或整个市场)维持上扬格局的关键因素之一。

如图中箭头C所示,随机指标(Stochastic)继续维持在70%水平以上的短期强势区域里,这表示综指目前短期的走势还是偏强的,直到随机指标跌破70%水平为止,届时便是综指技术调整开始的讯号。

总的来说,综指目前继续有转强的迹象,惟必须形成较高底(Higher-Low)后,才能算是涨势的形成。无论如何,只要综指能继续获得14、21、31天EMA动态支持线的扶持,那目前的技术展望还是偏好的.

FBM KLCI 30 March 2011
As indicated by A, the KLCI gap up on Wednesday, gaining 11.54 points or 0.76%. The KLCI breaks above the 1525 WinChart Automatic Fibonacci Retracement resistance, and now the 1525 WinChart Automatic Fibonacci Retracement is the immediate support for the KLCI, while the 14, 21, 31 EMA is still serving as the dynamic support to the KLCI. Resistance for the KLCI is seen at 1537 WinChart Automatic Fibonacci Retracement.
As indicated by B, total market volume increased 33.14%, with volume above the 40-day Volume Moving Average. As the inflow of fresh capital increases, it helps by offsetting some selling pressure, and improves liquidity of the market, thus help lifting the market sentiment.

As indicated by C, the Stochastic stays above 70%, in the short term bullish territory. The KLCI short term movement is likely to be positive as long as the Stochastic should stay above 70%, and if the Stochastic should fall below 70%, it would be a signal suggesting a beginning of a technical correction.

With the KLCI above the 14, 21, 31 EMA, the technical outlook for the KLCI is positive, together with stronger volume, the market sentiment as a whole is expected to improve. However, the KLCI has yet to form a higher-low, in order to form an uptrend.
HAPPY TRADING & GOODLUCK2ALL

WALL STREET : Bulls Reclaim Control

DJIA Dashes 81 Points Higher
Energy & Telecom Sector Led Charge
Stocks got off to a rough start this morning, spooked by a sixth straight month-over-month drop in the S&P/Case-Shiller home price index. However, the major market indexes clawed their way back into the black around midday, as the bulls viewed consumer sentiment data with rose-colored glasses. More specifically, while the Conference Board's consumer confidence index recorded its largest monthly decline in more than a year in March, the retreat wasn't as steep as analysts predicted. As a result of the Street's glass-half-full approach -- as well as a sector-wide rally among energy and telecom stocks -- the major market indexes spent the rest of the session blazing a steady path north of breakeven.

The Dow Jones Industrial Average (DJIA – 12,279.01) recovered from an initial retreat, tacking on 81.1 points, or 0.7%, to end just shy of an intraday peak. Home Depot (HD) led the bullish majority after announcing a healthy stock-buyback plan, while Hewlett-Packard (HPQ) paced the six black sheep with a loss of 2.4%.

The S&P 500 Index (SPX – 1,319.44) also climbed out of the red, tacking on 9.3 points, or 0.7%, by the close. However, the broad-market barometer's advance was once again stopped short at 1,320 level. Finally, the Nasdaq Composite (COMP – 2,756.89) fared the best of its peers, rallying 26.2 points, or nearly 1%, to end at a session high. What's more, the tech-rich COMP finished north of its 50-day moving average -- and the 2,750 level -- for only the second time since March 9.

Market strategists said the lack of bad market-driving news on Tuesday left traders hesitant to continue Monday’s selloff. “I think the market generally saw no follow-through on the selling pressure from yesterday, so that brought in a little bit of confidence,” quoted a dealer. "The unwinding of the softness in home prices following the expiration of government stimulus last year has largely run its course," remark another analyst.

Crude rebounds from escalating Arab uprising as Syrian Cabinet resign enmass
Crude futures bounced back today, as international powers continued to urge embattled leader Muammar Gaddafi to hit the bricks. In the same vein, geopolitical tension in Bahrain, Syria, and Yemen bolstered black gold during a thinly traded session. By the close, May-dated crude futures added &1.06, or 1.02%, to end at $105.04 per barrel.

May crude oil closed higher on Tuesday as it rebounded off support marked by the 20-day moving average crossing at 103.68. The high-range close sets the stage for a steady to higher opening on Wednesday. Stochastics and the RSI remain neutral to bullish signaling that sideways to higher prices are possible near-term. If May extends the rally off March's low, March's high crossing at 108.25 is the next upside target. Closes below the 10-day moving average crossing at 103.68 would signal that a short-term top has been posted. First resistance is last Thursday's high crossing at 106.69. Second resistance is March's high crossing at 108.25. First support is the 10-day moving average crossing at 103.68. Second support is March's low crossing at 97.02.

TECHNICAL ANALYSIS
Dow Jones Industrial Average
The Dow closed higher on Tuesday as it extends the rally off March's low. The high-range close sets the stage for a steady to higher opening on Wednesday.
Stochastics and the RSI are overbought but remain bullish signaling that sideways to higher prices are possible near-term.
If the Dow extends the aforementioned rally, February's high crossing at 12,391 is the next upside target. Closes below the 10-day moving average crossing at 12,025 are needed to confirm that a short-term low has been posted.

First resistance is today's high crossing at 12,280.
Second resistance is February's high crossing at 12,391.
First support is the 20-day moving average crossing at 12,057.
Second support is the 10-day moving average crossing at 12,025.
HAPPY TRADING

Tuesday, March 29, 2011

ZLBT Random Stock Picks >>> HEVEABOARD / ALAM MARITIM

Please click on images to ENLARGE

 ALAM financial standings turned RED becoz of VASTALUX
outstanding debts which has now been written off.
 Fresh start again on the fast track.
BON VOYAGE 
 DISCLAIMER
The information contained herein was obtained from sources believed to be reliable. However, we do not guarantee the accuracy and completeness of the report. Opinions expressed herein are subject to change without notice. This report is for information purposes only and should not be construed as an invitation, offer or solicitation to purchase or sell any futures product referred to herein. The Author may from time to time has an interest or position in the futures products or stocks mentioned. There is a risk of loss in trading stocks, futures & derivatives like products.
 
HAPPY TRADING & GOODLUCK2ALL

ZLBT Random Stock Pick >>> ALAM MARITIM (5115)

Please click on image to ENLARGE
Highly Recommended
GOODLUCK2ALL

ZLBT Random Stock Pick >>> SAPURA CREST

Please click on image to ENLARGE
Recommend : BUY ON DIP
HAPPY  TRADING

ZLBT Morning Views >>> Bursa Malaysia

Malaysian Shares May Extend Losses
The Malaysian stock market on Monday snapped the six-day winning streak in which it had collected more than 20 points or 1.5 percent. The Kuala Lumpur Composite Index finished just below the 1,515-point plateau, and now traders are bracing for continued if mild consolidation when the market kicks off trade on Tuesday.

The global forecast for the Asian markets is mixed with a downside bias as geopolitical concerns are likely to offset positive economic data from the United States. Gold stocks are expected to see profit taking, while natural gas, oil and technology stocks also are seen lower. The European markets were mixed and the U.S. bourses were slightly lower - and the Asian markets are tipped to split the difference.

The KLCI finished barely lower on Monday as softness from the industrial issues and plantation stocks was offset by gains from the financial shares.

For the day, the index eased 1.30 points or 0.09 percent to finish at 1,514.25 after trading between 1,511.98 and 1,517.47. Volume was 1.28 billion shares worth 1.61 billion ringgit. There were 380 decliners and 371 gainers, with 304 stocks finishing unchanged.

Among the actives, Tenaga Nasional, Nestle, Sime Darby, MISC, Maybank all finished lower, while CIMB Holdings ended higher.
Buying interest remained relatively subdued, however, as lingering concerns about the nuclear crisis in Japan and the ongoing military conflict in Libya helped to limit the upside.

The lead from Wall Street is slightly negative as stocks came under pressure in the latter part of the trading day on Monday after maintaining a positive bias throughout much of the session. The pullback by the markets came as concerns about developments overseas offset upbeat U.S. economic data.

HAPPY TRADING

ZLBT Morning Views >>> Wall Street / Crude Oil May '11

DJIA Surrender Early Lead;
Bulls Take a Breather
Stocks spent most of the session north of breakeven today, with the telecom sector leading the pack amid upgrades for Alcatel-Lucent, Nokia, AT&T, and Verizon Communications. In addition, news that consumer spending rose at its fastest pace in four months in February, as well as a dose of stronger-than-anticipated housing data, also helped the bulls maintain an early lead. However, a dip in disposable income, as well as discouraging inflationary data, took its toll in afternoon trading. Against this backdrop -- and thanks to a late-session retreat among tech stocks -- the major market indexes snapped their three-session run higher, following crude and gold futures into the red by the close.

The Dow Jones Industrial Average (DJIA – 12,197.88) was up more than 50 points in early trading, but reversed course in the final hour of the session to end with a loss of 22.7 points, or 0.2%. Only 10 of the Dow's 30 components avoided negative territory, with telecom titans AT&T and Verizon tacking on 1.8% and 1.2%, respectively. Meanwhile, Home Depot paced the 19 laggards with a loss of more than 2%, while General Electric finished right where it began.

The S&P 500 Index (SPX – 1,310.19) also turned tail in afternoon trading, surrendering 3.6 points, or nearly 0.3%, by the bell. Nevertheless, the broad-market barometer maintained its perch atop the 1,310 level for the second consecutive session.

Finally, the Nasdaq Composite (COMP – 2,730.68) led the late-session about-face, giving up an early lead to end 12.4 points, or 0.5%, lower. However, the tech-rich COMP seems to have found a floor in the 2,730 neighborhood.

Libyan Resolution hopes pushed crude futures to a one-week low
Crude futures negated nearly all of last week's advance today, as Western-backed rebels captured key crude ports in Libya. The anti-Gaddafi victories boosted hopes that the civil conflict will end sooner than expected, which could translate into a quicker-than-anticipated resumption of oil production in the region. By the close, May-dated crude futures surrendered $1.33, or 1.26%, to end at $104.07 per barrel -- black gold's lowest finish in a week.

TECHNICAL ANALYSIS
Crude Futures May 2011
May crude oil closed lower due to profit taking on Monday as it consolidates some of the rally off March's low. The low-range close sets the stage for a steady to lower opening on Tuesday. Stochastics and the RSI remain neutral to bullish signaling that sideways to higher prices are possible near-term.

If May extends the rally off March's low, March's high crossing at 108.25 is the next upside target.
Closes below the 10-day moving average crossing at 102.99 would signal that a short-term top has been posted.

First resistance is last Thursday's high crossing at 106.69.
Second resistance is March's high crossing at 108.25.
First support is the 10-day moving average crossing at 102.99.
Second support is March's low crossing at 97.02.


TECHNICAL ANALYSIS
Dow Jones Industrial Average
The Dow closed lower due to profit taking on Monday as it consolidates some of the rally off March's low. The low-range close sets the stage for a steady to lower opening on Tuesday. Stochastics and the RSI remain bullish signaling that sideways to higher prices are possible near-term.

If the Dow extends the aforementioned rally, February's high crossing at 12,391 is the next upside target. Closes below the 10-day moving average crossing at 11,988 are needed to confirm that a short-term low has been posted.


First resistance is today's high crossing at 12,272.
Second resistance is February's high crossing at 12,391.
First support is the 20-day moving average crossing at 12,048.
Second support is the 10-day moving average crossing at 11,988.

HAPPY TRADING

Monday, March 28, 2011

ZLBT looks at the week ahead >>> The FKLI

Weekly Technicals To Keep Bulls Rangebound
For the week ended on the 25th of March, 2011, the FKLI rebounded a total of 18.5 points, with a weekly high of 1518.5 and a weekly low of 1501.5 last Monday, total market volume traded was 26224 contracts versus 40310 previous week.
Weekly Chart : The FKLI Spot once hit 1501.0 but remain above the1500 psychological support amid negative impact from the radiation fallouts in Japan and Arabs uprisings in the Middle East & North Africa. he KLCI is still resisted 1530.5 & 1536.0 weekly resistance. The technical outlook for the FKLI uptrend remains positive in tandem with the cash market. The 1500 therefroe remains as an important support.
Bollinger Bands: The Bollinger Bands is basically not showing any signal right now, for the expansion was rather unpersuasive. Meanwhile, the FKLI closed above the Bollinger Middle Band, and as long as the FKLI stays above the Bollinger Middle Band, the immediate technical outlook for the FKLI shall remains optimistically positive.
MACD: The FKLI weekly MACD histogram is still in Rond Bottom formation now, but with the MACD line above the zero level, it suggests that the mid to longer term view of the FKLI is now on the postive side until the weekly MACD goes below the trigger or zero line.
RSI: After breaking above 50%, the weekly RSI stays mostly around but above the 50%, and therefore, unable to show any significant signals. It suggests that the FKLI mid term strength is at neutral.
Stochastic: Last week, the Stochastic still remains below 30%. This is the 3rd week the RSI have failed to breakaway from the "weak zone," leaving the short term outlook bearish. If the Stochastic could break above 30% into the 50% level it would be a short term neutral signal for the weekly FKLI. Until the weekly FKLI stochastic enters the 50% territory, keep bullishness at the back of your mind.
General Outlook for week ahead: Secondary indicators are showing conflicting signals, but Primary indicators still suggests neutral/weakness for the FKLI. Nevertheless, with latest weekly volume being way below previous week, we could assume that buyers are less aggresive and reluctant to take up new Long positions, and this implies that the market sentiments and future trader's confidence are neutral at best.
Nevertheless the price & volume negative divergence does not augurs well for the coming weeks and if there is no improvement in follow through buying, the FKLI will probably stay sideway or slightly downside bias.


HAPPY TRADING & GOODLUCK2ALL

Saturday, March 26, 2011

ZLBT looks at the week ahead >>> FBMKLCI Rock Steady

THE WORST COULD BE OVER
Nuclear Crisis & Arab Flashpoints Loom In The Shadow
The uptrend on Bursa Malaysia is likely to extend into next week with positive overseas developments prompting continued buying interest on the local front. The FBMKLCI is anticipated to continue trending higher towards the 1,530-1540 points resistance zone as investors react positively to regional news flow. But as a precautionary reminder, global markets are still hostages to any sudden negative newsbreak from Japan and the Middle East where Syria is the latest hair trigger situation. Radiations fallout fears and Arab uprisings still rule the day.

Given the fact that the bluechips index stayed above the 1,500 points level, after rising virtually seven straight days, showed that worries over the impact of the disaster in Japan on the rest of Asia has eased. Some degree of pessimism, however, still lingers at the mindset of investors which is the option rather than the norm.

However, it can be safely assumed (barring any unforeseen circumstances) the analytical beliefs, technically, the local market recovery from the March 11 sell-off was completed as the FBMKLCI had reclaimed the price level just before the Japanese tsunami selling started from 11th March 2011.

Furthermore, the stable Wall Street with the Dow breaking above the 12,000 level and with Nikkei rebounding 16 per cent also suggested that the sentiment had improved.

The numbers emissions noted that the trading sessionx has progressed with selling into strength dwindling and buying into weakness starting to rise in anticipation of more upside from solid first-quarter profits and impending General Elections speculated for this year as any GE rumours can only further boost the maket.

Sarawak starts the ball rolling ....
The looming Sarawak election would also favour Sarawak-based timber, oil and gas, and plantation shares such as Jayatiasa, Dayang and Sarawak Plantation.

This week, the FBM KLCI finished higher to settle at 1,515.55 compared with last Friday's 1,498.50 as demand bolstered from positive Wall Street and Asian cues as well as corporate news flow.

The FTSE Bursa Malaysia Emas Index increased 145.81 points to 10,416.93, the FTSE Bursa Malaysia Ace Index added 237.38 points to 4,223.54 and the FTSE Bursa Malaysia Mid 70 Index gained 274.66 points to 11,182.96.
The Finance Index increased 172.21 points to 13,736.580, the Plantation Index rose 68.74 points to 7,749.050 and the Industrial Index gained 31.04 points to 2,816.070.

The weekly volume surged to 6.125 billion shares, valued at RM8.214 billion, from 5.1 billion shares, valued at RM7.74 billion, last Friday.
The Main market turnover increased to 5.1 billion shares, valued at RM8.02 billion, from 4.1 billion units, valued at RM7.56 billion, registered last week.
HAPPY TRADING

WALL STREET : GDP Jump Propels DJIA to Weekly Win

Dow End Week With 3-Day Winning Streak
Tech stocks took the spotlight today, as traders reacted to last night's earnings reports from heavyweights Oracle Corp. (ORCL) and Research In Motion Limited (RIMM). The results were mixed; ORCL surged to a decade high after offering an upbeat outlook, while RIMM's lackluster forecast was greeted with a barrage of bearish brokerage notes. However, an upward revision to fourth-quarter gross domestic product (GDP) helped tip the scales in the bulls' favor, with the Commerce Department upping its growth estimate to 3.1% from 2.8%. As a result, the major market indexes ended the day -- and the week -- solidly north of key round-number levels, extending their winning streak to a third straight session.

The Dow Jones Industrial Average (DJIA – 12,220.59) ended on a respectable advance of 50 points, or 0.4%, as 16 of its 30 components trekked higher. IBM (IBM) and Chevron (CVX) set the pace for the rising blue chips, while Hewlett-Packard (HPQ) led the unlucky 13 laggards into the red. American Express (AXP) split the difference by finishing flat. The Dow wrapped up the week with an impressive gain of 3.1%, but the blue-chip barometer is still down 0.05% for the month of March. Nevertheless, the Dow ended well north of its 10-week moving average and the 12,000 level, both of which had been breached amid last week's market mayhem.

The S&P 500 Index (SPX – 1,313.80) managed a slim gain of 4.1 points, or 0.3%, to reclaim a foothold above its own 10-week moving average. The Nasdaq Composite (COMP – 2,743.06) didn't fare quite as well as its peers, eking out a 6.6-point rise, or 0.2%. The COMP closed just a hair's breadth below its own 10-week trendline. On a weekly basis, the SPX added 2.7%, while the COMP climbed 3.8%.

TECHNICAL ANALYSIS
Dow Jones Industrial Average
 The Dow closed higher on Friday as it extends the rally off last week's low. The mid-range close sets the stage for a steady to higher opening on Monday. Stochastics and the RSI are bullish signaling that sideways to higher prices are possible near-term. If the Dow extends the rally off last week's low, this month's high crossing at 12,283 is the next upside target. Closes below the 10-day moving average crossing at 11,964 are needed to confirm that a short-term low has been posted.

First resistance is today's high crossing at 12,259.
Second resistance is this month's high crossing at 12,283.
First support is the 20-day moving average crossing at 12,048.
Second support is the 10-day moving average crossing at 11,964.

HAPPY WEEKEND

Friday, March 25, 2011

Bursa Malaysia finish week on a firm note

BSKL Closing Market Report
FBMKLCI Chart commentaries
Share prices on Bursa Malaysia finished the week on a firm note today as positive global cues generated buying interests in the local market, dealers said.

The FTSE Bursa Malaysia KLCI (FBM KLCI) rose by 1.71 points to close at 1,515.55, supported by gains in RHB Capital, Petronas Chemicals, MISC and Genting Malaysia.
It opened at 1,515.91 in the morning.
 
RHB Capital rose 28 sen to RM8.31, Petronas Chemicals gained seven sen to RM6.83, MISC climbed six sen to RM7.81 and Genting Malaysia increased four sen to RM3.59
A dealer said positive corporate news on the local front and strong Wall Street overnight had boosted sentiment.
 Affin Investment Bank's head of retail research, Dr Nazri Khan, said the fact that the local index stayed above 1,500 level after rising virtually for seven straight days showed that worries over the impact of the disaster in Japan on the rest of Asia has eased.
The Finance Index rose 62.14 points to 13,736.58, Industrial Index was 6.47 points higher at 2,816.07, and the Plantation Index added 4.14 points to 7,749.05.

The FTSE Bursa Malaysia Emas Index climbed 20.54 points to 10,409.93, FTSE Bursa Malaysia Mid 70 Index moved up 47.05 points to 11,182.96 and the FTSE Bursa Malaysia Ace Index rose 34.09 points to 4,223.54.

Turnover rose to 1.16 billion shares worth RM1.73 billion from 1.042 billion shares worth RM1.853 billion yesterday.
Gainers outpaced losers by 483 to 278 while 316 counters were unchanged.

Among active stocks, Ho Wah Genting went up five sen to 68.5 sen and Tanco added two sen to 35.5 sen.

Perisai Petroleum climbed three sen to 76 sen and JCY International gained 1.5 sen to 66.5 sen. Karambunai was flat at 22 sen.

British American Tobacco gained 10 sen to RM48, Gamuda increased six sen to RM3.85, Maybank increased two sen to RM8.77 and KLK was four sen higher at RM21.08.
Volume on the Main Market increased to 947.887 million shares worth RM1.69 billion from 846.799 million shares worth RM1.442 billion on Thursday.

HAPPY WEEKEND

The Bollinger Bands Outlook for 20 Stocks

Technical Trading With Bollinger Bands
*Note: To qualify in this list above, the first sorting criteria is stock price must have just climbed or stayed ABOVE the middle Bollinger Band, followed by a second criteria that trading volume for the day must be significantly strong. This is a good watch list for momentum traders looking for short-term BUY ideas, as they are laggards with good upside potential towards the upper Bollinger band or higher to
TAKE PROFIT/SELL.
Caveat: Some stocks may continue to stay range bound and trade sideways, hence traders should refer to their respective charts to spot accumulation (volume growth) or breakout patterns.

INTERPRETATION OF THE BOLLINGER BANDS
Variable width bands that narrow during less volatile periods and widen during more volatile periods. As a general rule, in a bearish trend, traders should buy when share price touches the lower band and exit when price touches the middle band. The reverse is true in a bullish trend, ie.
buy when price touches the middle band and sell when price touches the upper band. Momentum traders will buy on price breaks above the upper band, and sell when price breaks below the lower band. Alternatively, a sharp move that originates at one band tends to go all the way to the other band, a usefulobservation when projecting price targets.
HAPPY TRADING

ZLBT Random Stock Picks >>> AirAsia + Maybank

AIRASIA (Code : 5099)
Technical Comments: The bullish breakout above the upper Bollinger band (RM2.62) on Air Asia shares triggered a fresh DMI buy signal on positive technical momentum, suggesting further upside bias to re-test RM3.04 (13/1/11 peak) before meeting substantial resistance. A confirmed breakout would target RM3.50 
MAYBANK (Code : 1155)
Technical Comments : Double buy signals on Maybank, specifically on the daily MACD and DMI trend indicators, supports further upside following recent base-building to at least re-visit RM9.38 (10/11/10). A confirmed breakout would target RM9.96 (1.236FP) and RM10.31 (1.382FP). Critical immediate support is at RM8.45 (61.8%FR).
GOODLUCK2ALL

WALL STREET : DJIA Rises On Slew of Corporate Earnings

SPX, COMP Put Round-Number Resistance in the Rearview Mirror
Stocks rocketed higher right out of the gate this morning, as a slew of solid earnings reports trumped overseas drama in both Europe and the Middle East. Dominating the earnings stage were Micron Technology (MU) and Red Hat (RHT), which blazed the trail into the black after reporting stronger-than-anticipated quarterly figures. Further fueling the bulls' early fire was news that first-time jobless claims fell last week, overshadowing reports of a surprise drop in durable-goods orders last month. Against this backdrop, investors had no trouble donning rose-colored glasses, essentially shrugging off intensified fighting in oil-saturated Libya and Portugal's seemingly imminent bailout. By the close, the Dow Jones Industrial Average (DJIA) left the 12,000 level in the dust, while both the S&P 500 Index (SPX) and Nasdaq Composite (COMP) put round-number resistance in the rearview mirror.

The Dow Jones Industrial Average (DJIA – 12,170.56) blazed a steady path higher today, notching a gain of 84.5 points, or 0.7%, to end atop the 12,100 level for the first time since before the March 11 earthquake in Japan. Only three of the Dow's 30 components bucked the trend, with Bank of America (BAC) and Cisco Systems (CSCO) each giving up nearly 1.3% by the close. Leading the bullish majority, meanwhile, were Hewlett-Packard (HPQ) and Home Depot (HD), which both tacked on more than 2%.

The S&P 500 Index (SPX – 1,309.66) also picked up steam as the session progressed, finishing with a gain of 12.1 points, or 0.9%. What's more, the broad-market barometer conquered the round-number 1,300 level for just the second time since March 9, and surmounted both its 10-day and 20-day moving averages for the first time in three weeks. In similar fashion, the Nasdaq Composite (COMP – 2,736.42) fared the best of the three, advancing 38.1 points, or 1.4%, to end atop its own 10-day and 20-day trendlines for the second time since Feb. 18. Even more noteworthy, perhaps, the tech-rich COMP toppled the 2,700 level -- a feat not accomplished since March 9.

TECHNICAL ANALYSIS
Dow Jones Industrial Average
The Dow closed higher on Thursday as it extends the rally off last week's low. The high-range close sets the stage for a steady to higher opening on Friday. Stochastics and the RSI are bullish signaling that sideways to higher prices are possible near-term. If the Dow extends the rally off last week's low, this month's high crossing at 12,283 is the next upside target. Closes below the 10-day moving average crossing at 11,944 are needed to confirm that a short-term low has been posted.

First resistance is today's high crossing at 12,184.
Second resistance is this month's high crossing at 12,283.
First support is the 20-day moving average crossing at 12,042.
Second support is the 10-day moving average crossing at 11,944.

HAPPY TRADING & GOODLUCK2ALL

Thursday, March 24, 2011

ZLBT Views >>> FBMKLCI + FKLI

Bluechips Index broke above FR 61.8% 1513 at close
FKLI to rise in tandem from change in sentiments 

 A breakout may have occured in the FBMKLCI but the lower volume makes it's legitimate strength suspect. The refusal of the FKLI Spot contract to move into higher premiums complicate matters even more.
FKLI traders in ZLBT are reminded to watch the FBMKLCI 1513 support cautiously.
When there is a change in polarity principles such as when Fibo R 61.8% was resistance yesterday turned support today, the index, if it's strength is genuine, have no reasons to revisit areas below 1513 again. Should that happen then then this can be view as a FALSE BREAK which is usually accompanied by low volumes.
Refer to their supports & resistances in both charts & data provided. And for protective measures, LONG position holder are reminded to keep a TS (trailing stop) handy to offset any sudden flurry sell.
Short position holders are also reminded to surrender your positions when another resistance level is taken out. U cannot win money by being stubborn.

HAPPY TRADING & GOODLUCK2ALL