ZLBT Chats

Friday, July 29, 2011

Technical Analysis : FBMKLCI 28/07/2011 / 综合指数 2011年07月28日

FBMKLCI 28/07/2011
Due to the over-night correction of the US market, the KLCI experienced a slightly stronger selling pressure on Thursday, with its intra-day low reaching 1544.96 points. However, the KLCI started to regain some of its earlier losses in the afternoon session, while managed to close slightly above the 1551 WinChart automatic Fibonacci retracement. Support for the KLCI remains at 1551 WinChart automatic Fibonacci retracement while the resistance is at 14, 21, 31 EMA dynamic resistance followed by the 1568 WinChart automatic Fibonacci retracement.

As indicated by B, total market volume increased about 1% on Thursday, with volume still above the 40-day volume moving average. This suggests that the market is actively participated. However, due to an obvious higher number of losers over winners, it suggests that the selling pressure was rather strong on Thursday.

As indicated by C, the Stochastic stays below the 30% level, and this suggests that the short term movement of the KLCI is still weak.

In conclusion, after breaking below the L1 uptrend line, the KLCI short term movement has been staying week, and together with the sensitive reaction of regional markets to the worry of default of the US, the KLCI is less likely to regain its strength. Technically, as long as the KLCI is still below the 14, 21, 31 EMA, the technical outlook for the KLCI shall stay negative. Next support for the KLCI is at 1500 psychological level.


综合指数 2011年 0728
由于隔夜美国大幅度下调,导致马股周四出现偏强的套利活动。如图中箭头A所示,富时大马综合指数(综指)周四虽然一度下滑至1544.96点的最低点,惟午盘后开始回弹,在1551点费氏支持线以上挂收,按日下跌6.26点或0.4%。综指当前的支持水平继续是1551点的费氏线,而阻力水平却是142131天综合加权移动平均线(Exponential Moving Average – EMA)及1568点的费氏线。

如图中箭头B所示,马股总成交量周四微增1%,而成交量也继续处于40天的成交量平均线以上。虽说若成交量能保持在40VMA以上表示市场的交投已经达到足够的水平,但是由于周四下跌股项明显多过上升的股项,这表示周四的卖压比资金流入的购兴来得强。

如图中箭头C所示,随机指标(Stochastic)依然处于30%水平以下的短期弱势区域里,这表示综指短期走势还是偏弱的,直到随机指标能成功的上扬突破30%水平为止。

总的来说,综指自跌破L1的上升趋势线后,短期走势逐渐偏弱,再加上区域股市也对美国当前面临的债务问题也出现了敏感的反应,因此综指暂时未有转强的讯号。以技术而言,只要综指继续在142131EMA动态阻力线遇阻的话,那短期的技术展望将是偏弱的。综指下一道支持水平落在1500点的整数水平。


祝你好运

Thursday, July 28, 2011

Bearish Mode Engulf Stocks, Index Futures

FBMKLCI, FKLI  DRAG BY REGIONALS
The FBM KLCI ended lower yesterday as regional index finished in mixed tone pending the result from U.S white house to whether raise the debt ceiling or default. Other news to follow.

Stock markets in Tokyo, Hong Kong and Sydney all ended lower Wednesday, as U.S. debt worries maintained their grip on the region’s investors. Japan’s Nikkei Stock Average JP:NIK -0.49%  closed the session down 0.5% amid strong levels for the yen, while Australia’s S&P/ASX 200 AU:XJO -0.79%  finished with a 0.8% loss after stronger-than-expected consumer inflation data raised the possibility of another interest-rate hike and sent the Australian dollar to a fresh pHong Kong’s Hang Seng Index HK:HSI -0.14%  managed to breach positive territory for part of the session, but weakness in shares of export-focused firms dragged the benchmark to a 0.1% loss. Among the region’s winners, the Shanghai Composite index CN:000001 +0.76%  ended with a 0.8% gain.


Local stock market is having tough time to sustain its recovery amid concern over possible debt crisis in the U.S market. Investors tend to book their profit earlier when the stock index rose as high as 1,565 level but the selling pressure overcame the market on late afternoon session. It is a waiting game at the moment. If the US politicians produce a plan to raise the debt limit, the outlook will turn bullish. It is likely that the politicians will wait for the rest of the week before agreeing on some sort of plan. Conversely, their failure to do that will turn the outlook bearish for both foreign currencies and stocks. The FBM KLCI retreated about 3.60 points to 1,558.17 level yesterday.

Technically, index futures is trending downwards with series of lower highs formed on hourly chart and daily chart as well. Fresh and stronger selling momentum would be materialize if the index futures breach below the previous lows. Furthermore, sentiments does not looks good on index futures as it closed 7 points lower to 1,552 level yesterday after it dip as low as 1,549.50. Previous low / Support area @ 1,547 is vulnerable if there is no positive news over debt-limit talks in the US soon.


Daily Pivot Point
R2= 1566
R1= 1559
S1= 1547
S2=1542

HAPPY TRADING

Tuesday, July 26, 2011

FBMKLCI / FKLI Oversold >>> Rebound?

Stocks & Futures Drifting Lower With Regionals
Stock index ended in red territory amid weakness across regional market yesterday. The indecisive decision on white house motion to pass the debt ceiling remain pending from all the senate. Bank stocks led European markets lower yesterday as the looming deadline to raise the U.S. debt ceiling and a further downgrade of Greece’s rating also spread to the Asian market. The FBM KLCI shed about 5.46 points to 1,559.60, second weakness so far. Major weakness identify on FBM KLCI as it has formed a lower high formation on daily chart, it could a beginning of down trend if it could violated the previous low below 1,550 level.

Technically. for index future the downside risk is higher at the moment as the index is staying below the resistance trend line. Market yet showing any promising of recovery as long as the resistance trend line is left un-touch. More lower high formations are also visible on the any time frame for index futures, indicating strong bearish sentiment.   


Daily Pivot Point
R2=1564
R1= 1560
S1= 1555
S2=1553

HAPPY TRADING

WALL STREET : Only four of the DJIA's 30 blue chips eked out a win

DJIA Surrenders 88 Points as Congress Plays Debt-Ceiling Chicken
U.S. stocks backpedaled right out of the gate today, as heightened debt concerns on both sides of the Atlantic sent buyers to the sidelines. In Europe, Moody's downgrade of Greek debt reminded traders of the potential ramifications of an extended stalemate on Capitol Hill, as a failure to up the federal debt ceiling by Aug. 2 could result in a debt downgrade -- or worse, a default -- for Uncle Sam. Against this uncertain backdrop, the Dow Jones Industrial Average (DJIA) swallowed a loss of 0.7%, while the S&P 500 Index (SPX) and tech-rich Nasdaq Composite (COMP) each gave up 0.6% by the close. Meanwhile, the CBOE Market Volatility Index (VIX - 19.35) ballooned almost 10.5% -- further reflecting the collective jitters on Wall Street -- while gold futures assailed new heights on a massive flight to safety.

The Dow Jones Industrial Average (DJIA – 12,592.80) finished north of its session low of 12,536.19, but still surrendered 88.4 points, or 0.7%, by the time the dust settled. Limiting the blue-chip barometer's fall was its 10-day moving average, which hasn't been compromised on a daily closing basis in more than a week. Among the Dow components, tech titans Hewlett-Packard (HPQ) and Microsoft Corp. (MSFT) led the four advancers with gains of 1.1% and 1.4%, respectively, while Boeing (BA) paced the 26 decliners with a loss of 1.9%.

Meanwhile, the S&P 500 Index (SPX – 1,337.43) also ended off its session low, but gave up 7.6 points, or 0.6%, by the bell. In similar fashion, the Nasdaq Composite (COMP – 2,842.80) tagged an intraday nadir of 2,828.91, but trimmed its deficit to 16 points, or 0.6%.


Crude lower for 1st session out of 5

Despite a softer greenback, dollar-denominated crude futures ended lower for the first session in five today. Pressuring black gold were global debt concerns, which sparked fears about fizzling energy demand. By the close, September-dated crude oil gave up 67 cents, or 0.7%, to end at $99.30 per barrel.


HAPPY TRADING

Friday, July 22, 2011

Technical Analysis : 综合指数 2011年07月22日 / FBMKLCI 22/07/2011

综合指数 2011年 0722

如图中箭头A所示,富时大马综合指数(综指)周五虽然开高,但是却未能上扬突破L1线,而同时在142131天综合加权移动平均线(Exponential Moving Average – EMA)遇阻,按日微跌0.75点。综指当前的阻力水平依然是1600点的心理水平,支持水平则是1551点的费氏线。

如图中箭头B所示,马股总成交量周五虽然减少2.8%,但是依然能维持在40天的成交量平均线以上,这表示马股当前的交投是稍微活跃起来了,而一般来说,若马股总成交量能维持在40天的成交量平均线以上的话,那将有助于马股整体上转强。

如图中箭头C所示,随机指标(Stochastic)还未能突破30%水平,因此暂时未能摆脱短期弱势的区域里。同时,这表示者创业板短期的走势还是偏弱的。

总得来说,综指短期虽然是偏弱,但是却还未形成跌势,直到综指形成较低高峰(Lower-High)的特征为止,届时综指才会有转弱的先兆。无论如何,如今成交量稍微增加,再加上区域股市纷纷反弹,这将有望带动改善马股的投资气氛,对个股的表现有利。

祝你好运

WALL STREET >>> DJIA Takes Back 12,700

Bulls Charge : Dow Soars 1.2% as Greek Plan, Earnings Fuel Optimism

Stocks blazed a steady path into the black today, as Wall Street celebrated encouraging earnings and economic reports, and some debt-related headway across the pond. Specifically, European Union (EU) leaders detailed plans to prevent the contagion of Greek debt, which helped overshadow the lingering debt-ceiling gridlock on Capitol Hill. Meanwhile, Morgan Stanley (MS) led the earnings festivities, as investors applauded the financial concern's narrower-than-expected quarterly loss. Furthermore, the Philly Fed index's stronger-than-anticipated rebound, as well as upbeat data from the Conference Board, helped keep a jump in weekly jobless claims on the proverbial backburner. Against this bullish backdrop, the Dow Jones Industrial Average (DJIA) ended at its loftiest settlement price since May 10.

The Dow Jones Industrial Average (DJIA – 12,724.41) finished near a session high, advancing 152.5 points, or 1.2%, to end atop the 12,700 level for the first time in two weeks. Only Intel Corp. (INTC) bucked the trend higher, shedding 0.8%, while Bank of America (BAC) paced the advancers with a 3.9% gain.

In similar fashion, the S&P 500 Index (SPX – 1,343.80) rallied almost 18 points, or 1.4%, conquering the 1,340 level for the first time since July 8. Finally, the Nasdaq Composite (COMP – 2,834.43) pared its surplus to 20.2 points, or 0.7%, after earlier soaring as high as 2,847.41.


TECHNICAL ANALYSIS
Dow Jones Industrial Average

The Dow closed sharply higher on Thursday as it extends this week's rally. The high-range close sets the stage for a steady to higher opening on Friday. Stochastics and the RSI are diverging and are turning bullish signaling that sideways to higher prices are possible near-term. Closes below the 20-day moving average crossing at 12,434 would confirm that short-term top has been posted. If the Dow extends the rally off June's low, May's high crossing at 12,876 is the next upside target.

First resistance is the 87% retracement level of the May-June decline crossing at 12,752.
Second resistance is May's high crossing at 12,876.
First support is the 20-day moving average crossing at 12,434.
Second support is Monday's low crossing at 12,296.

Crude Closing In On $100

Crude futures extended their winning streak to three straight sessions today, and even made a brief foray north of $100 for the first time in more than a month. Progress on the Greek debt situation bolstered hopes for improving demand, while the International Energy Agency's (IEA) decision against a second release of oil reserves also boosted black gold. Against this backdrop, September-dated crude oil futures tacked on 73 cents, or 0.7%, to end at $99.13 per barrel.

HAPPY TRADING & GOODLUCK2ALL

Technical Analysis : 综合指数 2011年07月21日 / FBMKLCI 21/07/2011

综合指数 2011年 07月 21

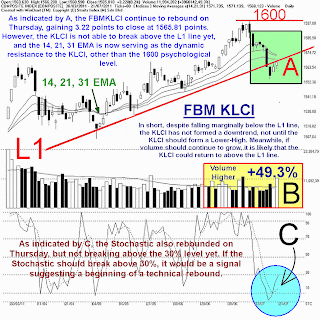
如图中箭头A 所示,富时大马综合指数(综指)周四继续回弹,不过却还未能重返L1的上扬趋势线以上。无论如何,综指回弹3.22点,以1565.81点挂收。综指当前阻力水平是142131天综合加权移动平均线(Exponential Moving Average – EMA)的动态阻力线,及1600点的心理阻力水平,支持水平则是1551点的费氏线。

如图中箭头B所示,马股总成交量周四明显增加49.3%,并突破40天的成交量平均线(VMA)。以技术而言,成交量明显的增加,一般上是一个正面的讯号,这表示马股的交投开始活跃起来。若接下来成交量能维持在40天的VMA以上,那将有助于马股重返涨势。

如图中箭头C所示,随机指标(Stochastic)周四继续的反弹,不过却还未成功突破30%水平,当前的随机指标依然处于短期弱势区域里。接下来若随机指标能上扬突破30%水平,那综指短期技术反弹的讯号。至于综指短期能否转强,那就必须等到随机指标上扬突破70%水平的讯号。

总的来说,综指虽然稍微跌破L1线,但却还未形成跌势,除非接下来综指形成较低高峰(Lower-High),届时综指才有转弱的迹象。另一方面,若成交量能继续维持在40VMA以上,那综指有望重返L1线以上。


祝你好运

Bursa Malaysia : Bluechips Index Slow Recovery To Continue

Upside Momentum Slow & Steady
FBM KLCI : The bluechips index manage to inches up about 3.22 points to ended slightly higher to 1,565.81 level yesterday. The helping sectors behind stock index recovery was spearheaded by banking stocks all the way. It seems some investors are willing to increase their portfolio in risky asset and start accumulating shares in the market. 

Major external market sentiment remain weak as white house is yet finalize to resolve the debt ceiling issues in Washington which will due in 2nd August and escalating worries over Euroz zone debt crisis that might be contagious to other European countries.

FKLI : The FTSE Bursa Malaysia 
KLCI (FBM KLCI) futures on Bursa Malaysia 
Derivatives closed mixed amid lack of buying 
interest, dealers said.

July 2011 and September 2011 declined one
point and three points, respectively, to close at 
1,563 and 1,562 while August 2011 and 
December 2011 gained half-a-point and 1.5 
points to 1,563.5 and 1,565, respectively. 
Volume rose to 6,303 lots from Wednesd
ay’s 6,189 lots while open interest narrowed 
to 23,208 contracts from 23,701 previously.


Technically, we could expect some recovery on index futures as well judging from the formation of higher lows on hourly time frame. FKLI contracts also manage to rebound from a oversold level of 1,547 previously. For today, support level is located around 1554 while resistance is pegged at 1,570.

Daily Pivot Point
R2= 1570
R1= 1566
S1= 1558
S2= 1554

Thursday, July 21, 2011

ZLBT's Random Stock Picks >>> E and O / Muhibbah

Technical Comments: The oversold stochastic reading on E&O shares implies limited downside risk with retracement supports at RM1.43 (61.8%FR) and RM1.36 (50%FR), and good rebound potential to RM1.52 (76.4%FR), with the mid (RM1.54) and upper (RM1.65) Bollinger bands as stronger resistance.

Technical Comments : Extreme oversold signals on Muhibbah shares should encourage technical rebound to RM1.25 (38.2%FR) or RM1.38 (50%FR) before pausing. Key support is seen at RM1.09, the 23.6%FR.

DISCLAIMER

The information contained herein was obtained from sources believed to be reliable. However, we do not guarantee the accuracy and completeness of the report. Opinions expressed herein are subject to change without notice. This report is for information purposes only and should not be construed as an invitation, offer or solicitation to purchase or sell any futures product referred to herein. The Author may from time to time has an interest or position in the futures products or stocks mentioned. There is a risk of loss in trading stocks,futures & derivatives like products.

GOODLUCK

每日技术分析 >>> 综合指数 2011年 07月 20日

综合指数 2011年 07月 20日

由于亚太区域股市受到欧美股市反弹的带领而回弹,富时综合指数也随之上扬。如图中箭头A所示,综指上扬后精确的在L1趋势线遇阻,以1562.59点闭市。所以L1继续成为综指当前的阻力线,而综指目前的支持水平维持在1551点的费氏线,阻力水平则是1569点的费氏线。


如图所示,布林频带(Bollinger Bands)打开的幅度减低至10%,这表示综指出现技术反弹。若综指接下来能上扬突破布林中频带,那综指将有望摆脱下跌的窘境。

如图中箭头B所示,马股成交量减少17.84%,未能超越40天成交量移动平均线(VMA),这显示市场面对走势不明朗的前景下淡静,不过若综指要成功转强,成交量仍然须达到40天平均值。

如图中箭头C所示,随机指标(Stochastic)虽然处于30%以下,不过%K线成功的上扬突破%D线,这意味着综指的短期走势有望出现技术反弹,惟随机指标必须上扬突破30%,才能确认此短期反弹的讯号。

虽然综指已第三个交易日跌破了31天的加权移动平均线(EMA),不过若综指能在短期内重返EMA以上或者出现横摆巩固的箱型走势,这将破坏综指转弱的趋势。总的来说,综指的短期走势在跌势中出现技术回弹,而综指的中长期跌势则并未完全获得确认。

祝你好运

FKLI >>> First Sign Of Recovery


FKLI Slightly Higher On Cash Market Gains

The FKLI contracts on Bursa Malaysia Derivatives 
closed mostly higher yesterday, tracking 
gains on the cash market.


July 2011 ended two points better at 1,564, 
August 2011 rose 1.5 points to 1,563, September 
2011 gained 2.5 points to 1,565 but 
December 2011 declined 2.5 points to 
1,563.5. 
Volume fell to 6,189 lots from Tuesday’s 
12,220 lots while open interest rose to 
23,701 contracts from 23,678 previously. 
The underlying benchmark FBM KLCI rose 6.95 
points or 0.45 per cent to close at 1,562.59.

Technically, an early sign of recovery has sighted for both stock index and index futures. Index futures has formed a Bullish candle that pierce entirely Tuesday Bearish candle. While for index futures, the long legged hammer candle formed on Tuesday does gave away the exhausted Bears when it rallies and close 2 points higher at 1,564 yesterday. For today, immediate resistance is pegged at 1,570 while support is located at 1,561. 


Daily Pivot Point
R2= 1570
R1= 1567
S1=1561
S2= 1558

HAPPY TRADING

Wednesday, July 20, 2011

FBMKLCI in 5-day losing streak. Time for rebound?

Stock index closed lower again yesterday but not with a double digits drop as previous Monday dropped. The FBM KLCI retraced about 6.94 points to closed lower at  1,555.64. 
With concern over Euro zone debt crisis that might get out of hand and U.S market debt default worries, every traders are put on high alerts level especially when the market start to dropped from a new high. July will remain a resilient month to trade where both local and foreign sentiment will weight the direction of the market. Currently, stock market is sitting duck as investors are worried about the debt crisis faced by biggest market of all while the other hand we are expecting our market to continue its preceding uptrend based on positive government expenditure on local development and possible general election. These theme will be the headlines for the market to move generally.

Technically, we could expect some technical rebound from the spot month July contract judging from a long lower tail Bullish candles that formed on the late afternoon session yesterday. For today, support is located around 1,540 while resistance is pegged at 1,568.5. 


Daily Pivot Point
R2= 1576
R1=1568.50
S1= 1550.50
S2= 1540

HAPPY TRADING & GOODLUCK2ALL

WALL STREET : Bulls Claim Best Day Of Year 2011

Stocks Soar on Earnings, Housing
Rays of Hope on Capitol Hill
The bullish stars seemed to align today, with Wall Street celebrating a batch of blue-chip earnings, solid economic data, and progress on Capitol Hill. Right out of the gate, well-received earnings reports from IBM Corp. (IBM) and Coca-Cola (KO) helped the Dow Jones Industrial Average (DJIA) to a triple-digit surplus, overshadowing a flood of earnings flops from the financial sector. Elsewhere, a stronger-than-expected housing report only added to the bullish momentum, as did an afternoon news conference from Washington, D.C. Specifically, President Obama said Congress is one step closer to upping the U.S. debt ceiling, and sang the praises of a new debt-reduction plan from the Senate's bipartisan "Gang of Six." Against this bullish backdrop, all three major market indexes settled comfortably in the black, with the Dow notching its best session of the year.

The Dow Jones Industrial Average (DJIA – 12,587.42) ended near an intraday peak, adding 202.3 points, or 1.6%, by the bell. As such, the blue-chip barometer reclaimed a perch atop both its 10-day moving average and the 12,500 level, but couldn't muster enough steam to conquer the 12,600 marker. Among the Dow's components, only Bank of America (BAC), Johnson & Johnson (JNJ), and 3M Company (MMM) bucked the trend higher, while IBM paced the 27 advancing equities with a gain of 5.7%.

In similar fashion, the S&P 500 Index (SPX – 1,326.73) tacked on a healthy 21.3 points, or 1.6%, to end north of its own 10-day trendline for the first time since July 8. Finally, thanks to some earnings-related optimism in the tech sector, the Nasdaq Composite (COMP – 2,826.52) bested its peers with a gain of 61.4 points, or 2.2%. What's more, the tech-rich COMP muscled back atop the round-number 2,800 level for the first time in more than a week.

Crude Oil Rebound 1.6% On Weaker Greenback
Crude futures bounced back today, as stronger-than-expected housing data revived hopes for oil demand. Furthermore, the greenback lost ground against most of its counterparts, whetting foreign-currency holders' appetite for the dollar-based commodity. Against this backdrop, crude oil for August delivery advanced $1.57, or 1.6%, to finish at $97.50 per barrel.

HAPPY TRADING

Tuesday, July 19, 2011

Crude Palm Oil Slips On Profit-Taking, US, Europe Worries

CPO futures ended lower on previous Friday but manage to finished the week positively. Tracking the performance of Soya oil, palm oil market took a dip on morning and afternoon session but the slump were limited by positive export figures announce by cargo surveyors ITS and SGS. 

ITS reported that Malaysia July 1-15 Palm Oil Exports 752,047 Tons, Up 12% On Month while SGS announced July 1-15 Palm Oil Exports 731,842 Tons, +4.6%. Market does not re-act to these news until the late afternoon session where the benchmark Sept start to bounce back after it has fell down to 3,115 level. The benchmark Sept saw a swift rebound right after it hit that low to 3,138 as Buyers step in to accumulate Long position due to temporary oversold condition. Palm oil market is likely to recover further as volume rose steadily when the market goes up, a basic condition to identify genuine market movement and to filter out false direction. 

Technically, the benchmark Sept had breakout from a congestion period judging from daily chart, this event might caused the market to have a major rebound. The highlighted eclipse plus green horizontal line is likely serve a base or major support for the time being.  

Crude palm oil futures on Malaysia’s derivatives exchange fell Monday, with profit-taking kicking in after earlier gains, as the market took cues from the weakness in other commodities.

The new benchmark October CPO on the Bursa Malaysia Derivatives ended 1.2% lower at MYR3,078 a metric ton, after trading between MYR3,068 and MYR3,140/ton. Sept contract closed at 3085 down 31.

HAPPY TRADING

20 Middle Bollinger Band Rangebound Stocks For Your Perusal

*Note: To qualify in this list below, the first sorting criteria is stock price must have just climbed or stayed ABOVE the middle Bollinger Band, followed by a second criteria that trading volume for the day must be significantly strong. This is a good watch list for momentum traders looking for shortterm BUY ideas, as they are laggards with good upside potential towards the upper Bollinger band or higher to TAKE PROFIT/SELL. 
Caveat: Some stocks may continue to stay range bound and trade sideways, hence traders should refer to their respective charts to spot accumulation (volume growth) or breakout patterns.

DISCLAIMER

The information contained herein was obtained from sources believed to be reliable. However, we do not guarantee the accuracy and completeness of the report. Opinions expressed herein are subject to change without notice. This report is for information purposes only and should not be construed as an invitation, offer or solicitation to purchase or sell any futures product referred to herein. The Author may from time to time has an interest or position in the futures products or stocks mentioned. There is a risk of loss in trading stocks,futures & derivatives like products.

GOODLUCK