ZLBT Chats

Saturday, September 29, 2012

Wall Street Week Ahead: Stock bulls eye Spain, Bernanke and jobs

DJIA goes Down for the Day but Up for the Quarter
Wall Street will open October with a busy week, highlighted by low expectations for global manufacturing data and the U.S. jobs report, but that could set the stage for positive surprises that help lift the market.
The S&P 500 finished its third positive quarter in the last four on Friday, despite suffering its largest weekly percentage decline since June. For the past three months, the S&P 500 gained 5.9 percent - its best third quarter since 2010. In contrast, the index was down 1.3 percent for the week.
The benchmark S&P 500 earlier this month reached its highest level since late 2007. Yet uncertainty remains over whether stocks can hold their gains against the headwinds of a struggling economy. That explains, in part, the retreat over the last several days.
The S&P 500 hit a high of 1,474.51 in mid-September before pulling back by a bit more than 2 percent. A run at 1,500 seems possible, but the flurry of economic and world events ahead probably will prevent a major advance in the coming week.
On Friday, the Dow fell 48.84 points, or 0.36 percent, to 13,437.13. The S.& P. 500 fell 6.48 points, or 0.45 percent, to 1,440.67, and Nasdaq fell 20.37 points, or 0.65 percent, to 3,116.23. For the third quarter, the Dow Jones industrial average rose 4.3 percent and the Nasdaq composite index 6.2 percent.
Despite Friday’s losses, the Standard & Poor’s 500-stock index advanced 5.8 percent over the last three months, mainly on expectations that central banks around the world would take steps to stimulate their economies. That brought the benchmark index’s (SPX}) advance so far this year to 14.6 percent.
 
HAPPY TRENDING

Technical Analysis : FBMKLCI 28-09-2012 / 富时大马综合指数 2012-09-28

富时大马综合指数 2012-09-28
由于受到欧美股市回弹的影响,富时大马综合指数周五开高,随后上扬突破了142131EMA的动态阻力线,挂1636.66点,按日上扬8.82点或0.54%。(参考箭头A)综指目前的支持落在1625的水平。综指下一道关口便是1655点的历史高峰水平。
 
如图中箭头B所示,马股总成交量增加里35.96%,不过成交量却还未能达到40天的成交量平均线(VMA)的水平。若马股交投继续改善并上扬突破40天的成交量平均线(VMA)的话,那表示市场的投资气氛也将会有改善,届时有利于马股整体上的后市。
 
如图中箭头C所示,随机指标(Stochastic)继续上升,并稍微突破70%的水平。不过,由于随机指标的%K线只是稍微的突破70%的水平,因此这短期转强的讯号仍然有待进一步的确认。
 
总的来说,综指自周一在1600点反弹以来已经连续上涨了4日,呈现了预算案前的小涨潮,再加上这是第3季度的最后一个星期的交易,也有进行季度的橱窗粉饰的活动使到综指上涨。不过以技术而言,综指却还未能恢复之前的涨势,除非综指能成功的突破1655点的大关。 
 
祝你好运

Thursday, September 27, 2012

FKLI closes 15.5 points higher @1633.5 >>> 27 Sept 2012

FKLI Moves Into Premium

Don't Be A Stubborn Trader
As human, we have different personality traits and each can be good or bad to us. As a trader, it is important to have the capability to overcome your ‘bad’ personality traits and don’t let them influence your decisions. One such personality trait is stubbornness.
 
HAPPY TRENDING

FKLI >>> Market Commentary / Technical Outlook 27 Sept 2012

FKLI Daily technical analysis:
The FKLI spot month contract ended slightly higher on Wednesday, which was followed the gain in cash market despite weakening in the external market did not affect much on the price. At the close, the FKLI price was up 1.5 pts or 0.09% to 1,618.
Based on the daily chart, another positive candle was formed on Wednesday where it indicated that mild buying interest remains supported the FKLI price. During the trading session, price had tested again the resistance line but it was unable to break above that resistance line as drawn in the chart. Our review remains unchanged, where the price could be trading in between the range of 1,587- 1,620 level. However, if the price is able to break either way, a new direction may be established.
Referring to the daily MACD indicator, it signals that market sentiment remains negative and the upside potential may be limited. However, the alternative MACD 6,12,6 (Short parameters) tells a different story. Refer to chart below ........
 
As always, intraday support and resistance levels will be eyed.


Technical indicators:

MACD = Negative, ADX=Negative


Intraday technical support & resistance for 27th Sept 2012:


 1st support 1,607; 2nd support 1,600
 1st resistance 1,620; 2nd resistance 1,628-40

HAPPY TRENDING

Tuesday, September 25, 2012

Technical Analysis : FBMKLCI 25/09/2012 / 富时大马综合指数 2012-09-25

FBM KLCI 25 Sept 2012
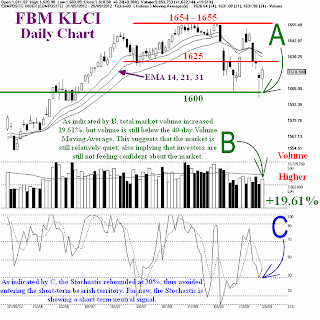
On Tuesday, the KLCI opened at 1611.82 points, 0.56 points lower than yesterday's closing. Soon after opening, the KLCI slipped 9.29 points to its daily low of 1603.09 point, but as the KLCI is nearing its 1600 support level, the KLCI started to rebound, lifted by heavy weighted bluechips. At the close, the KLCI ended at 1618.58 points, gaining 6.2 points or 0.38%. Resistance for the KLCI remains at 1625 as well as the 14, 21, 31 EMA dynamic resistance, while the support is still at 1600, as indicated by A.
 
As indicated by B, total market volume increased 19.61%, but volume is still below the 40-day Volume Moving Average. This suggests that the market is still relatively quiet, also implying that investors are still not feeling confident about the market.
 
As indicated by C, the Stochastic rebounded at 30%, thus avoided entering the short-term bearish territory. For now, the Stochastic is showing a short-term neutral signal.
 
In conclusion, the KLCI tested the 1600 level again, and fortunately it rebounded from the 1600 level, thus avoiding forming a downtrend once again. However, since the KLCI is currently below the 14, 21, 31 EMA dynamic resistance, the immediate technical outlook is turning cautious.
 
富时大马综合指数 2012-09-25
综指周二以1611.82 点开市,比昨天的收市低了0.56点。综指开市后因一度下滑 9.29 点,至1603.09点的全日最低,惟在接近1600点整数心理支持水平时获得扶持而回弹,甚至把扭转局势,使得综指以1618.58点挂收,按日上扬6.20点或0.38%。综指目前的阻力依然是1625点及142131EMA的动态阻力线。支持水平则仍然是1600点的关口。(参考图中箭头A
 
如图中箭头B所示,马股总成交量比昨天稍微增加了19.61%,不过成交量还是未能达到40天的成交量平均线(VMA)的水平。这表示市场的交投还未达到活跃的水平,同时继续暗示着投资者对马股的信心还未完全恢复。
 
如图中箭头C所示,随机指标(Stochastic)在30%的水平反弹,因此避开了陷入短期弱势的格局。目前的随机指标显示着短期中立的讯号,直到随机指标上扬突破70% 或 下跌跌破30%水平为止。
 
总的来说,综指再次试探1600点大关,所幸的综指继续在1600点获得扶持而回弹,因此再一次的避开了跌势的形成。不过,由于综指目前继续处于142131EMA动态阻力线以下,因此目前的技术展望是处于谨慎的状态。
 
祝你好运

Saturday, September 22, 2012

5 Mistakes To Avoid When Trading Future Markets

It’s a well known fact that 95% of “retail” traders (i.e. the small speculators) will lose money trading the financial markets.  Little wonder then that small speculators are referred to as “dumb money” by investment professionals and monitored as a contrarian indicator for future price direction.

It is not simply that the little guys choose the wrong trade, there are a number of classic mistakes that are repeated over and over again that mean losing is all but a certainty, leaving the 5% of winners and the professionals to clean up.

This article highlights what we believe to be the top five mistakes that traders make that can be avoided and increase your odds of success dramatically.


1. Not Planning Your Trades

It is not sufficient to look at a particular market, choose to either buy or sell and cross your fingers hoping for the best.  You must devote time to study your chosen market, decide whether the prevailing trend is up or down, what timescale this trend is over and where the points of support and resistance are.

You have to plan where you are going to buy or sell, where to place your stop loss and most importantly where to exit the trade.  Then, once the trade is planned and executed, you must show discipline – you made the trade for a good reason with solid justification, so any changes need equally solid justification.

2. Lettings Losses Run and Closing Winners Too Early

There is a tendency to become too emotionally involved with a trade once it has been placed, and to want the trade to succeed too much.

Therefore, novice traders tend to let losses run too long, by either widening stops or ignoring signals that the trade is going wrong, in a desperate attempt not to lose money.  All that happens is when you do eventually lose, the loss is a huge one.

Learn to take small losses and you won’t ever get smashed by an enormous loss that blows you out of the water completely – the markets will always be there tomorrow, as long as you still have capital, you are in the game.

On the flipside, novices tend to get over excited when their trades move the right way and into a profitable position and the tendency is to close the trade out earlier than planned to “bank” the profit.  Of course there are times when this is the right course of action, but if your plan said close out at a certain point, unless something has changed, stick to the plan.

3. Chasing Losses

The other classic trading mistake is to “chase” losses – after taking a loss on a trade (hopefully a small, manageable one - see above!) the natural urge is to “put it right” by getting straight back into the markets and winning the lost cash back as soon as possible.

As we know, the only way to trade is by planning each trade and executing it carefully, jumping back in to the markets after calling a losing trade is NOT going to work.

The best advice is to take a few days out of the markets, regroup and plan your next trade. 


4. Overtrading

Everyone loves the thrill of placing a trade and entering the market – many traders tend to overtrade, placing too many trades that haven’t been planned properly just to be “in the game” and part of the action.

We at UKGTE only make about 10-20 carefully planned trades a year as overtrading means more money is lost on commissions and spreads and the likelihood of losing is higher as trades are more frequent.


5. Staking Too Much

Money management is the key to real success – too many traders risk far too much of their trading pot on each trade, looking for the “big win” rather than gradual and controlled growth through smaller more manageable trades.

If you go seeking the “big win”, more often than not you will end up finding the “big loss” and then its game over.
 
 
WARNING
DO NOT TRADE WITH MONEY THAT IS NOT YOURS
IT CAN ONLY BRING FORTH MORE TRAGEDIES
GOODLUCK

Wall Street Takes Breather After Two-Week Rally

U.S. stocks tally first weekly drop in three
Dow falls 0.1% week-on-week

U.S. stocks on Friday finished nearly unchanged, giving Wall Street its first weekly drop for September.

“After having two explosive weeks to the upside, where the S&P 500 was up 3.5%, it’s a huge victory to come out this week virtually flat in the face of the concerns we have: the Middle East, the fiscal cliff and more bad news than good in the economic data stream,” said a senior equity strategist.

 
“The tug of war between economic fundamentals and central-bank easing is more balanced this week after central banks dominated over the past eight weeks,” noted another as what he termed as a  “glaring market divergence” that has been going on all week culminated Friday with the Dow transportation index DJT -1.03%  breaking to its lowest level since Aug. 2 and to its lowest close since early June.
 
The Dow Jones Industrial Average DJIA -0.13%  fell 17.46 points, or 0.1%, to 13,579.47, leaving it down 0.1% from the week-ago close.
 
ANALYSTIC QUOTES :
 
"Financial stocks are expected to have the best growth rate, compared with large reported losses last year. Earnings for the sector are expected to grow by 9.9%, with American International Group Inc. AIG -0.09% and Goldman Sachs Group Inc. GS +0.21%expected to be the largest contributors."
 
"The outlook  doesn’t bode well for a market that’s at multi-year highs and will soon be facing added volatility as the November elections and the January “fiscal cliff” come closer."
 
"Third-quarter revenue for companies in the S&P 500 is expected to rise by 0.1% from a year ago. Energy company revenues are forecast to fall 16.3% and materials by 2.8%, according to FactSet. Much of that stunted revenue growth comes from weak economies in Europe, less favorable foreign exchange rates, and slowed growth in such emerging markets as China."

"After last week's QE3 announcement and market surge, it was pretty obvious that we were overbought on a short-term basis. Well, we got the breather and the market pretty much grinded sideways each and every day this week. With almost no earnings and little economic data, today's market didn't have too much to digest." 

"The end is finally here and we can finally pull the plug on this comatose week of market action. We are still a couple of weeks away from earnings season, but we may start to see some warnings and pre-announcements coming next week."
 
HAPPY WEEKEND

Tuesday, September 18, 2012

Technicalities FBM KLCI 18 Sept 2012 >>> Tough to Crack 1,655 Record High


Strong rebound last week reverse the recent sell-off from a fresh three month low
Week-on-week, the benchmark FTSE Bursa Malaysia Kuala Lumpur Composite Index (FBM KLCI) gained 18.4 points, or 1.13% to 1,642.95. Average daily traded volume and value shrank to 946.5 million shares and RM1.7 billion, compared to the 1.33 billion shares and RM1.7 billion average the previous week.
FKLI Spot month September KLCI futures contract traded on the Bursa Malaysia Derivatives Berhad climbed 23.5 points or 1.46% last week to 1,638.5, reducing the discount to the cash index to 4.45 points, compared to the 9.55-point discount the previous week, as the futures market undertone stayed cautious despite the strong rebound.
 
The daily slow stochastic indicator for the FBM KLCI has climbed into the neutral zone after
triggering a buy signal last week (Chart 1), but the weekly indicator hooked down from the
overbought region following the previous week’s sell signal. The 14-day Relative Strength Index
(RSI) recovered to a more bullish reading at 54.99, while the 14-week RSI hooked up for a reading at 61.09 as of last Friday.

The daily Moving Average Convergence Divergence (MACD) trend indicator’s trigger line has
turned upwards, signaling improving upside momentum, but the weekly MACD just flashed a sell signal (Chart 2). Meantime, the +DI and –DI lines on the 14-day Directional Movement Index (DMI) trend indicator are contracting towards each other, poised to reverse last week’s bearish signal.
 
Conclusion
Despite the strong rebound seen on blue chips late last week, the weaker than usual buying momentum and discount on the futures market implies upward momentum could stall as the index climbs higher towards the record high, as market undertone remained cautious. While short-term technical momentum has turned positive, note that weekly indicators remained bearish given the sell signals on weekly stochastics and MACD indicators.
Hence, it would be challenging for the index to overcome the 1,655.49 record peak of 3 Sept this
week (Chart 3), unless buying momentum and external sentiment improves further. In any case, higher upside hurdles upon a breakout would be at 1,660 and 1,672, the respective 1.618 and 1.764 Fibonacci Projection targets of the 1,609 high of 3 April to the 1,526 low of 18 May, with 1,691 as the one-to-one projection target. Immediate support is revised upwards to 1,636, the 50-day moving average, followed by 1,609, the 3 April peak, with better support at 1,591, which is the 50% retracement of the run-up from 1,526.6 low on 18 May to the 1,655.49 peak of 3 Sept.

HAPPY TRENDING


Saturday, September 15, 2012

WALL STREET 15 Sept 2012 >>> U.S. stocks extend Fed-inspired rally

DJIA ends at multi-year high on Feds stimulus promise
U.S. stocks rose for a fourth straight session on Friday to close out the week at nearly five-year highs after the Federal Reserve took bold action to spur the economy, a move that could keep equities buoyed in the coming months. Equities are in a run-up that also pushed the S&P 500 to end higher for four consecutive months. The extended advance has come mainly from actions by Europe's and the United States' central banks to keep interest rates low and stimulate their struggling economies.

The Fed said Thursday that it would keep up its aggressive bond-buying until unemployment falls. Chairman Ben Bernanke said he wanted to see a convincing improvement in the economy that could deliver sustainable job creation.

Scaling back from a 113-point climb, the Dow Jones Industrial Average DJIA +0.40%  gained 53.51 points, or 0.4%, to 13,593.37, the highest close since Dec. 10, 2007. It gained 2.2% on the week, tallying gains for eight of the past 10 weeks. The sharp turn higher for equities came after the Fed unveiled an open-ended plan to buy mortgage-backed assets at a clip of $40 billion a month. The central bank also pledged to take more actions, if necessary, to give the stodgy economy and labor market a fresh jolt of power.

It was the best week for the Dow since early June. The broader markets had a strong week as well: the S&P 500 jumped 1.9% and the Nasdaq rallied 1.5%. 

ANALYSTS QUOTES

"Today is simply a continuation of the strength we saw yesterday." 

"Bernanke's comments are going to create an artificial floor on the market, meaning that we could see higher prices over time. Any correction that we get will be no more than a few percentage points."

"Right now we have this short-term euphoria. But then the question is where do we go from here? I think after a week or so, if the underlying economic data doesn't change, you're going to see the market drop a bit and we'll continue to plod along until the election."

“We had a fair amount of data out right on the heels of the Fed, but probably the biggest influence today is still the after-effects of the Fed’s announcement yesterday.”

"We are starting to get into that heady territory where you need to be on the defensive. Trying to squeak out the last 5 percent of a move when there is potentially a 15 to 20 percent downside in my opinion is pretty dangerous stuff."

"While everyone is trying to figure out what QE3 means to the economy, stocks have spoken, and they like it. At the same time, hedge funds have totally dropped the ball and missed most of this rally. There's a good chance these Johnny-come-latelies could be the fuel for the next surge higher."


 HAPPY TRADING