Please click on images to ENLARGE

FCPO Recommendation
BUY ON DIP / SELLOFF
Preferably when FLURRY SELL OCCUR >>> BUY


FKLI Recommendation
SELL Into Strength / Rally
Preferably when FLURRY BUY occur >>> SELL

HAPPY WEKEND
HAPPY WEKEND


 The S&P 500 Index (SPX – 1,101.60) also clawed back from its session lows, eking out a gain of less than a point, or 0.01%. For the week, the SPX gave back 0.1%, but managed to finish the month 6.9% ahead – its best monthly rally since July 2009. Finally, the Nasdaq Composite (COMP – 2,254.70) followed suit, erasing its early deficit to end 3 points, or 0.1%, higher.
 Note the last 3 candles of the above Spot Month chart >>> small real bodies denote fading buying frenzy as compared to last week's action.
 Only Spot month contract made green >>> the rest of forward months and indication or rollovers rathe than continuous buying or LONG Comittments.
 Bulls stomped on the brakes today as a wave of disappointing data washed over Wall Street. The Commerce Department kicked things off by reporting that U.S. durable goods orders fell 1% in June, defying expectations for a 1% increase during the month. Unfortunately, the afternoon release of the Fed's Beige Book struck a similarly troublesome note.
  The Dow Jones Industrial Average (DJIA – 10,497.88) settled on a modest loss of 39.8 points, or 0.4%, as 21 of its 30 components backpedaled. Boeing paced the decliners in the wake of its revenue miss, but Pfizer (PFE) wasn't far behind. Among the nine advancing blue chips, Verizon Communications (VZ) racked up the day's biggest gain. Despite the day's downbeat finish, the Dow notched a third straight daily finish above its 80-day moving average, which neatly contained the blue-chip barometer's intraday low.
 Oil futures fell in sympathy with stocks today, as traders passed over riskier assets in favor of safer investing havens. The day's lackluster durable goods data was a point of concern, as was the Energy Information Administration's (EIA) confession of an unexpected weekly climb in crude inventories. As traders fretted over the prospects of a weaker economic recovery, crude for September delivery slipped 51 cents, or 0.8%, to settle at $76.99 per barrel.
 Physical demand remains relatively muted, but the malleable metal clawed its way into the black on the backs of bargain hunters. Month-to-date, the most active December contract has shed nearly 7% of its value, which effectively tempted a few thrifty traders. Gold for December delivery wrapped up the day 60 cents higher at $1,162.40 per ounce.
 IT HAPPENS TO MANY OF US What about you?
 The FTSE Bursa Malaysia Kuala Lumpur Composite Index (FBM KLCI) futures contracts on Bursa Malaysia Derivatives closed higher Tuesday supported by late buying, dealers said.
 Crude Palm Oil Ends Up On Weather; Crop Uncertainty
  "July's palm production has been below expectations. The single-digit gain (during the higher production cycle) is a far cry from the previous year's performance," said the trading head at a Malaysia-based major plantation company.
 Please click on image to ENLARGE
 EUR_USD
 GBP_USD
 Recommend


 HAPPY WEEKEND FOLKS
 Definition
 1. We see it at a market top or during an uptrend.
 Important Factors:
 The Dow suffered a triple-digit selloff on Wednesday as new comments from Fed chief Ben Bernanke reminding Wall Street of the “unusually uncertain” nature of the economic recovery spooked the markets and drowned out a cluster of bullish earnings reports.
 The Dow Jones Industrial Average (DJIA – 10,120.53) pared the worst of its intraday decline by the close, but still swallowed a sizable deficit of 109 points, or 1.1%. Only four Dow members closed higher, with Coca-Cola leading the way on the heels of its quarterly report. Meanwhile, financial firms Bank of America and JPMorgan Chase paced the 26 decliners. Despite today's drop, the Dow is still perched just a hair's breadth above its 10-week moving average, which has been toppled only once on a weekly closing basis since April.
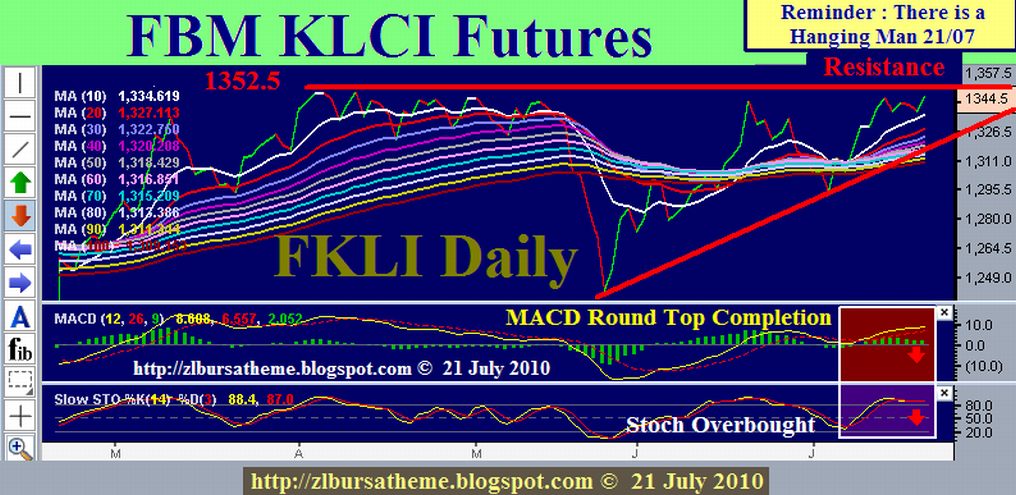
FKLI Recommendation
The appearance of the Hanging Man on 21/07 has U-turned the FKLI sentiments.
SELL INTO STRENGTH / RALLY
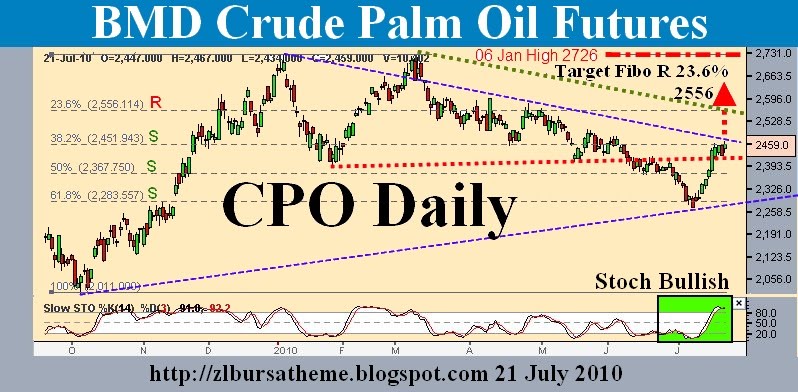 FCPO Recommendation
BUY ON WEAKNESS / PULLBACKS
Preferably during a FLURRY SELL-OFF

Volume was at 5,438 lots, higher than yesterday's 5,319 lots, while open interest increased to 21,046 contracts from 20,617 contracts previously.
On the cash market, the benchmark KLCI index ended 3.35 points higher at 1,341.02.
FKLI Recommendation
BUY ON DIPS
 Pasaran niaga hadapan minyak sawit mentah ditutup tinggi hari ini mendapat rangsangan daripada kekukuhan harga minyak soya dan minyak mentah. Belian menampung kekurangan oleh peniaga juga membantu meningkatkan sentimen pasaran. Minyak mentah berada pada hampir paras tertinggi dalam tempoh tiga minggu pada US$75 setong yang membawa kepada sentimen positif bagi minyak sawit mentah yang kelihatan sebagai pilihan lebih baik bagi sumber biodiesel.
 Composite Index 20/07/2010
 As indicated by B, total market volume increased 32.7%, with volume above the 40-day VMA level. This suggests that the overall market participation is now improving. Generally, if volume should stay firmly above the 40-day VMA level, the market sentiment is expected to improve.
 综合指数 2010年 07月 20日
 如图中箭头B所示,马股成交量增加32.7%,并且创下3个月的新高水平,这也使到成交量成功的保持在40天成交量移动平均线(VMA)以上,这显示市场交投活跃。此高于40天平均值的成交量若能维持下去,那市场的承接力量将增加,这将有助于综指继续转强。
 Crude Palm Oil Rally Not Sustainable;
  There was a fear factor in the rush to cover shorts in a big way - fear that the slew of good and encouraging news would continue to see print and in newswire reports. And concern that world commodity markets, especially the soyabean oil futures market, would extend the length of their past fortnight's strong winning streak. The bellwether US soyabean oil futures market extended its run-up the price chart last week, tacking on 81 points or 2.46 per cent to settle last Friday at 38.31 US cents a pound. Industry estimates of a 2 per cent drop in the September through November US soyabean harvest fuelled soyabean oil's surge to a 14-week high.
 The real catalyst for last week's short-covering binge, though, was the latest export estimates. Societe Generale de Surveillance's and Intertek Agri Services' July 1-15 export estimates were figured at a combined average of some 688,000 tons, up a hefty 84,000 tonnes or 13.85 per cent from that for first half June. It was not so much that exports have started picking up, but the realisation that Muslim countries in the Middle East and Pakistan have started buying palm oil in earnest to stock up on cooking oil ahead of the Hari Raya Aidilfitri (end-of Ramadan festive season) that really ignited last week's rally. Hari Raya Aidilfitri, or Eid al-Fitr, is likely fall on September 10.
 # THE BAR AND VOLUME CHART: This is the daily high, low and settlement prices of the most actively traded basis month of the crude palm oil futures contract. Basically, rising prices accompanied by rising volumes would indicate a bull market.
FCPO Recommendations
SELL INTO STRENGTH / RALLY


 Rising Twiggs Money Flow (21-day) indicates short-term buying pressure. Reversal below the lower border, however, remains as likely and would offer a target of 9000*.


