 综合指数 2010年 03月 25日
如图中箭头A所示,富时大马创业板周四继续回弹,惟精确的在14天的加权移动平均线(Exponential Moving Average - EMA)遇阻,按日上扬3.3点或0.1%。于此来看,14、21、31天EMA依然是创业板的动态阻力线(Dynamic Resistance),而富时大马创业板仍然还未摆脱偏弱的格局。
如图所示,创业板支持水平依然是4180点的费氏线,阻力水平除了是14、21、31天的EMA以为,便是4296点的费氏线。
如图中B圈所示,随机指标(Stochastic)周四继续上扬,并且稍微突破70%水平。这表示创业板当前依然处于技术反弹的格局中。接下来若随机指标能维持在70%水平以上,那创业板短期的走势有望继续改善,或有转强的机会。
如图中箭头C所示,平均乖离振荡指标(MACD Histogram)继续微扬,并且突破了零轴。这表示创业板当期正处于技术反弹,或有转强的迹象。以技术而言,只要平均乖离振荡指标能继续上扬,那创业板走势将继续改善,直到平均乖离振荡指标形成相对的圆顶(Rounding Top)为止。
总的来说,辅助指标虽然继续显示富时大马创业板转强的迹象,惟创业板依然在14、21、31天的EMA遇阻,所以未能确认转强的讯号。无论如何,所有的涨势都是从技术反弹慢慢的演变而来,所以投资者可以继续留意创业板是否能上扬突破14、21、31天的EMA,创业板随后若形成较高底(Higher-Low)时,便是形成涨势的特征之一。
 Composite Index 25/03/2010
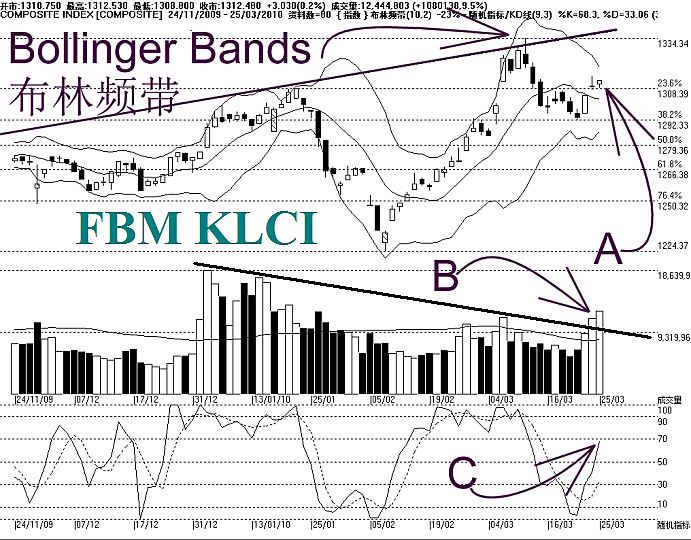
The KLCI gained 3.03 points on Thursday, to close at 1312.48 points. The KLCI is currently supported by the 1308 Automatic Fibonacci Retracement, which is the 23.6% Fibonacci Retracement line, and the resistance for the KLCI is at 1334.34 Automatic Fibonacci Retracement.
As indicated by A, the Bollinger Bands contracted 23%, suggest that the KLCI is still consolidating, and also preparing for a new movement, and the new movement shall begin when the Bollinger Bands re-expands, and the direction shall be determined by the relative position of the KLCI against the Bollinger Middle Band.
As indicated by B, total market volume increased 9.5%, with volume firmly above the 40-day VMA level. The increased of volume suggests an improvement of the market participation, thus implies that the investors confidence is gradually recovering.
As indicated by C, the Stochastic breaks above 50% level, suggesting that the KLCI continues its technical rebound. If the Stochastic should break above 70% level, it would be a short term bullish signal for the KLCI.
In conclusion, the contraction of the Bollinger Bands suggests that the KLCI is now gearing up for a new movement, and we shall wait for the re-expansion of the Bollinger Bands. If the Bollinger Bands should expands with the KLCI above the Bollinger Middle Band, together with the Stochastic breaking above 70% level, it would be an ideal bullish signal, and of course, volume has to stay above the 40-day VMA level.


No comments:
Post a Comment