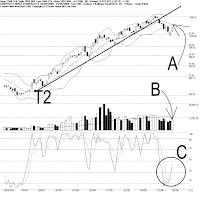
As shown on the chart above, the KLCI continued its rebound on Wednesday, after being supported by the 1035 Fibonacci Retracement, closing the day 13.37 points or 1.3% higher. Therefore, the 1035 Fibonacci Retracement is still the support for the KLCI, while the resistance is at the Bollinger Middle Band.
As indicated by A, the Bollinger Middle Band is the first target of the KLCI rebound. If the KLCI should break above the Bollinger Middle Band, there is a chance for the KLCI to regain its strength. However, if the KLCI should remain resisted by the Bollinger Middle Band, the immediate outlook for the KLCI is still bearish biased. Nevertheless, the Bollinger Bands Width only expanded 3% on Wednesday, comparing to the 15% previously; this implies that the Bollinger Bands Width might be contracting.

 As indicated by B, total market volume declined 1.2%, with volume still staying below the 40-day VMA level. This shows that the the market participation overall is still weak, despite the KLCI rebounded over 13 points. In short, the KLCI is less likely to pickup its strength without sufficient inflow of fresh buyings.
As circled at C, the Stochastic broke above 30%, suggesting the KLCI is now technically rebounding, breaking away from the short term bearish region. However, if the KLCI should resume its bullish biased movement, the Stochastic would have to break above 70%.
After successfully rebounded from the 1035 Fibonacci Retracement, the KLCI failed to form a downtrend; but without substantial volume, the KLCI is still unlikely to resume its uptrend. Nevertheless, if the Bollinger Bands Width should contract, the KLCI is expected to consolidate, and from the technical stand point, the best consolidation would be a low-fluctuation, sideways movement.
如图所示,综合指数自1035点胜图自动费氏线反弹以来,周三继续上扬,按日扬升13.37点或1.3%,所以1035胜图自动费氏线继续是综指目前的支持水平,阻力水平则是布林中频带的动态阻力线。
如图中箭头A所示,综指技术反弹的第一个目标是布林中频带,若综指能够上扬突破布林中频带,那综指才有望转强,否则若综指在布林中频带遇阻回软,综指将继续有下跌的风险。另一方面,布林频带周三打开幅度从15%减少至3%,这是综指止跌及进入巩固格局的迹象。
如图中箭头A所示,综指技术反弹的第一个目标是布林中频带,若综指能够上扬突破布林中频带,那综指才有望转强,否则若综指在布林中频带遇阻回软,综指将继续有下跌的风险。另一方面,布林频带周三打开幅度从15%减少至3%,这是综指止跌及进入巩固格局的迹象。
如图中箭头B所示,马股总成交量周三稍微减少1.2%,成交量继续处于40天的成交量平均线(VMA)以下。尽管综指周三回弹13.37点,市场的交投依然属于淡静,所以综指目前依然未有转强的条件。

 如图中C圈所示,随机指标(Stochastic)上扬突破30%水平,暂时摆脱短期弱势的格局,这是综指出现技术反弹的讯号。接下来若随机指标能够继续上扬,综指有望维持目前反弹的走势,至于综指能否转强,那就要看随机指标是否能够上扬突破70%水平。
综指在1035点胜图自动费氏线获得扶持后反弹,避开进入跌势,惟依然缺乏足够的成交量,所以综指目前依然未能转强,直到综指上扬突破布林中频带为止。无论如何,接下来若布林频带收窄,那综指将进入巩固格局,而从技术分析的角度来看,最好的巩固格局就是低幅度的横摆巩固。


No comments:
Post a Comment