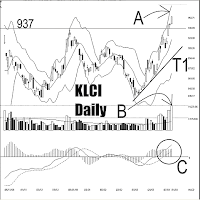
 As indicated by A, the Bollinger Bands Width stopped expanding on Tuesday (0%), suggesting that the KLCI is likely to consolidate. Nevertheless, the KLCI ended 12.30 points higher on Tuesday, closing at its daily high of 953.71 points. Support for the KLCI remains at 937 WinChart Automatic Fibonacci Retracement and the Bollinger Middle Band dynamic support; T1 uptrend line is also the dynamic support for the KLCI, while the resistance is at 972 WinChart Automatic Fibonacci Retracement.
As indicated by B, total market volume increased 27.1%, marking a 14 months volume new high. This shows that the current market is indeed well-participated, thus the market sentiment is likely to be positive. If the KLCI should consolidate, volume will generally decline, as investors are taking cautions while waiting at the sidelines. Nevertheless, provided that the volume is still above the 40-day VMA level, the positive market sentiment is expected to sustain, thus a positive criteria for the KLCI uptrend.
As circled at C, the MACD histogram is still rising, while no rounding top is sighted yet. Therefore, this suggests that the market movement for the short term is still bullish biased, until the MACD histogram should form a rounding top.
Despite some tendency of a consolidation, it has to confirm with the Bollinger Bands Width contraction. If the KLCI should consolidate, the best scenario for its consolidation would be a low fluctuation sideways movement. If the KLCI should remain supported by the Bollinger Middle Band after its consolidation, the current uptrend shall remains intact.
综合指数 2009年 4月 14日
如图中箭头A所示,布林频带(Bollinger Bands)周二停止打开(0%),这表示综合指数的涨势有缓慢下来的迹象。无论如何,综指周二进一步上扬12.3点或1.3%,并且以全日最高点挂收。综指目前的支持水平依然是937点的胜图自动费氏支持线及布林中频带(Bollinger Middle Band)的动态支持水平,T1也是综指上扬的动态支持水平,阻力水平则是972点的胜图自动费氏阻力线。
如图中箭头B所示,马股总成交量增加27.1%,创下14个月的成交量新高,这表示目前市场的交投热炽,这显示市场仍然有足够的承接力量,是有利于综指维持目前上扬的趋势。若综指接下来进入调整巩固格局的话,成交量一般上会减少,这是因为投资者在市场调整巩固时离场观望的态度而至。无论如何,只要成交量还是保持在40天的成交量平均线(VMA)以上的话,市场投资的乐观情绪将得以保温。
如图中C圈所示,平均乖离的振荡指标(MACD Histogram)至今依然没有形成圆顶(Rounding Top),这表示综指短期还没有确认出现技术调整或巩固的讯号。只要平均乖离的振荡指标继续上扬的话,综指短期的后市还是有望看高一线,直到平均乖离振荡指标形成圆顶为止。
综指上扬的动力虽然有缓和下来的迹象,但必须要等到布林频带开始收窄才能确认综指调整巩固的讯号。无论如何,从技术分析的角度来看,最好的调整也莫过于低幅度的横摆巩固。若综指在调整后依然在布林中频带获得扶持的话,那综指基本上还是处于上扬的格局中。


No comments:
Post a Comment