
KLCI is only manage to advance 0.55 points as KLCI approach 1163 Fibonacci Retracement, this 50% retracement between historical high 1524.69 pt and 801.27 pt, there for KLCI is expected to face some tough resistance at around 1163.
As indicated by A, Bollinger Band contracted 5%, this is a confirmation sign of KLCI technical correction. Normally should Bollinger Band continue to narrow, KLCI technical correction will continue to take place, and the first target of the correction would be Bollinger Middle Band, it is also KLCI potential Dynamic Support line.
Total market volume further declined 5% (refer to B), this is the sign that the market is still lack of substantial trading volume, this is one of the reason behind today's technical correction.
 As circled at C, the MACD Histogram declined today and formed a Rounding Top, this is the confirmation of KLCI technical correction, usually KLCI will continue to self-correct, until MACD Histogram form an opposite Rounding Bottom.
In a nutshell, due to the fact that the market is still lack of confidence, which causes a lightly traded volume in addition to profit taking in index linked stocks, not to mention there are sign that investors are switching to second and third liners, and KLCI corrected technically as the result of that. In the the current situation, Bollinger Middle Band become a very important support line, should KLCI supported by the Middle Band, KLCI would still have a chance to rebound or soar; otherwise should KLCI failed to be supported by Middle Band, it could be an early sign of KLCI turning weak.
综合指数 2009年 7月 27日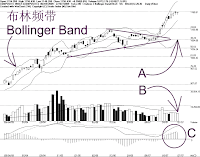

如图所示,富时综合指数继续受到1163点的胜图自动费氏线阻力,只稍微上扬0.55点,这是因为1163点是综指自1524.69点的历史最高水平至801.27点的50%黄金分割,所以阻力特强。综指当前的支持水平落在1096点,这也是综指在6月12日时的最高水平,这是典型的阻力反转成为支持的例子。
如图中箭头A所示,布林频带(Bollinger Band)开始收窄5%,这是综指开始技术调整的确认讯号,通常若布林频带持续收窄,综指将维持目前技术调整的格局,而布林中频带(Bollinger Middle Band)则会成为综指调整的第一目标,也是综指的动态支持线。
如图中箭头B所示,马股总成交量减少5%,继续低于40天的成交量平均线(VMA),所以综指在缺乏足够成交量的情形下,出现技术调整。
 如图中C圈所示,平均乖离的振荡指标(MACD Histogram)开始下滑,使到振荡指标形成圆顶(Rounding Top),这是综指短期技术调整的讯号,换句话说,综指将维持短期技术调整的格局,直到振荡指标形成相对的圆底(Rounding Bottom)为止。
总的来说,由于投资者信心未完全恢复,所以市场交投依然低迷,再加上投资者趁机套利综指成份股项,也有转向二三线股的迹象,这使到综指欲振乏力,开始技术调整。接下来布林中频带将成为综指一道重要的支持线,若综指能成功在布林中频带上获得扶持的话,综指将有再度转强的希望;反之当综指跌破布林中频带时,就可视为综指转弱的讯号。


No comments:
Post a Comment