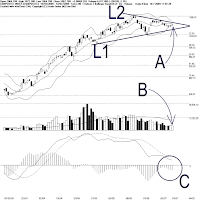
As indicated by A, the FBM KLCI tested the Bollinger Middle Band as well as the L2 line of the Symmetrical Triangle on Friday, and it was precisely resisted at the L2 line, and therefore, the KLCI failed to break away from the consolidation pattern. The L2 line and the Bollinger Middle Band remain as the resistance for the KLCI while the L1 line and 1035 Fibonacci Retracement are still the supports.
As shown on the chart, the Bollinger Bands Width expanded only 2%, and therefore, insignificant to suggest any signal. At the moment, the KLCI is still preparing for a new movement, and the new movement shall only be revealed when the Bollinger Bands Width expands clearly.
As indicated by B, total market volume declined 2.3%, with the volume clearly below 40-day VMA level. This shows that the market is indeed lightly participated, implying that investors confidence is still low. Therefore, if volume should remain below the 40-day VMA level, the KLCI is less likely to regain its strength.
 As circled at C, the MACD histogram is still falling but at a slower pace. Therefore, the MACD histogram might be forming a rounding bottom. If the MACD histogram should form a rounding bottom, it would be a signal suggesting the short term movement of the KLCI is likely to pick up some strength.
The KLCI has been consolidating within the Symmetrical Triangle for a month, and the fluctuation is getting narrower. This is the typical characteristic of the Symmetrical triangle for the Buyers and Sellers are gradually building up a consensus about the market price while waiting for a fresh lead. Therefore, the break out of the Symmetrical is a crucial signal. If the KLCI should break above the L2 line, with substantial volume reaching the 40-day VMA level, it would be a bullish breakout. However, if the KLCI should break below the L1 line, the outlook for the KLCI shall remain weak.
As shown on the chart, the Bollinger Bands Width expanded only 2%, and therefore, insignificant to suggest any signal. At the moment, the KLCI is still preparing for a new movement, and the new movement shall only be revealed when the Bollinger Bands Width expands clearly.
As indicated by B, total market volume declined 2.3%, with the volume clearly below 40-day VMA level. This shows that the market is indeed lightly participated, implying that investors confidence is still low. Therefore, if volume should remain below the 40-day VMA level, the KLCI is less likely to regain its strength.
 As circled at C, the MACD histogram is still falling but at a slower pace. Therefore, the MACD histogram might be forming a rounding bottom. If the MACD histogram should form a rounding bottom, it would be a signal suggesting the short term movement of the KLCI is likely to pick up some strength.
The KLCI has been consolidating within the Symmetrical Triangle for a month, and the fluctuation is getting narrower. This is the typical characteristic of the Symmetrical triangle for the Buyers and Sellers are gradually building up a consensus about the market price while waiting for a fresh lead. Therefore, the break out of the Symmetrical is a crucial signal. If the KLCI should break above the L2 line, with substantial volume reaching the 40-day VMA level, it would be a bullish breakout. However, if the KLCI should break below the L1 line, the outlook for the KLCI shall remain weak.
如图中箭头A所示,富时综合指数周五上探布林中频带及L2的对称三角形,惟精确的在L2线上遇阻,所以综指依然未能摆脱对称三角形的盘整格局。布林中频带及L2动态阻力线继续是综指的阻力水平,支持水平则是L1线及1035 点胜图自动费氏线。
如图所示,布林频带周五稍微打开2%,但这并未能明显指示任何讯号,所以综指继续酝酿着新的走势,直到布林频带明显打开为止,届时综指才有望摆脱目前横摆的僵局。
如图中箭头B所示,马股总成交量稍微下跌2.3%,这使到成交量继续处于40天的成交量平均线(VMA)以下,这表示市场的交投依然不足,投资者对马股未能完全恢复信心,所以综指还是缺乏转强的重要条件。
如图总C圈所示,平均乖离振荡指标(MACD Histogram)下跌趋势开始缓慢下来,所以有形成圆底(Rounding Bottom)的迹象,若接下来平均乖离振荡指标形成圆底,那将是综指短期有望转强的讯号。
 综指已在对称三角形内盘整一个月,而且波动幅度越来越小,这是典型的对称三角形特征,是买方与卖方对市场的水平开始达到共识,等待新的指引所致,所以接下来综指突破三角形将是关键性的讯号。若综指上扬突破L2线,成交量必须要达到40天平均值,那才可以确认综指转强的讯号;相反的,若综指跌破L1线,综指后市将继续看淡。
如图所示,布林频带周五稍微打开2%,但这并未能明显指示任何讯号,所以综指继续酝酿着新的走势,直到布林频带明显打开为止,届时综指才有望摆脱目前横摆的僵局。
如图中箭头B所示,马股总成交量稍微下跌2.3%,这使到成交量继续处于40天的成交量平均线(VMA)以下,这表示市场的交投依然不足,投资者对马股未能完全恢复信心,所以综指还是缺乏转强的重要条件。
如图总C圈所示,平均乖离振荡指标(MACD Histogram)下跌趋势开始缓慢下来,所以有形成圆底(Rounding Bottom)的迹象,若接下来平均乖离振荡指标形成圆底,那将是综指短期有望转强的讯号。
 综指已在对称三角形内盘整一个月,而且波动幅度越来越小,这是典型的对称三角形特征,是买方与卖方对市场的水平开始达到共识,等待新的指引所致,所以接下来综指突破三角形将是关键性的讯号。若综指上扬突破L2线,成交量必须要达到40天平均值,那才可以确认综指转强的讯号;相反的,若综指跌破L1线,综指后市将继续看淡。


No comments:
Post a Comment