ZLBT Chats

Thursday, September 30, 2010

TECHNICAL ANALYSIS >>> FBMKLCI 30/09/2010 / 综合指数 2010年09月30日

FBM KLCI 30/09/2010
As indicated by A, the FBM KLCI rose 1.72 points to close at 1463.50 points. Generally, the KLCI is still consolidating with the over head resistance at 1479.59 while the supports are found at 1436 followed by 1424 WinChart Automatic Fibonacci Retracement.

As shown on the chart above, the Bollinger Bands contracted 5%, suggest that the KLCI is indeed consolidating, while also preparing for a new movement. The market direction is likely to be uncertain, until the re-expansion of the Bollinger Bands, then the new direction would be determined by the position of the KLCI above or below the Bollinger Middle Band.
As indicated by B, total market volume increased 16.2%, with volume still above the 40-day VMA level. Generally, the market sentiment as a whole is still on the positive if volume could maintain firmly above the 40-day VMA level.

As indicated by C, the MACD histogram fell below the zero level, suggesting that the MACD line has crossed below the trigger line. This is a signal suggest a weakening movement for the KLCI, and the weakening of the KLCI is expected to carry on until the MACD histogram should form a Rounding Bottom.
The KLCI is consolidating with positive technical outlook, as the KLCI uptrend is unaffected, with the 14, 21, 31 EMA still supporting the KLCI. Nevertheless, whether or not the KLCI could resume its uptrend rally, we shall later decide with a clearer Bollinger Bands signal.

综合指数 2010年 09月 30日
如图中箭头A所示,富时综合指数微扬1.72点,以1463.50点闭市,这显示综指继续的横摆巩固,综指当前的阻力依然是1479.59点的费氏线,支持水平则是落在1436点及1424点的费氏线。

如图所示,布林频带(Bollinger Bands)收窄5%,这显示综指目前正处于横摆巩固,直到布林频带重新打开为止。这也意味着综指正在酝酿着一个新的趋势,综指的新趋势将取决于综指处于布林中频带(Bollinger Middle Band)的相应位置。

如图中箭头B所示,马股的成交量增加16.2%,所以成交量得以保持在40天成交量移动平均线(VMA)以上,这显示市场的交投继续活跃,这对增加市场的承接力量是有帮助的。若市场的承接力量继续增加,换句话说,更多的买盘流入,那综指将有望在套利卖压被完全吸纳后重新获得上扬的机会。

如图中箭头C所示,平均乖离的振荡指标(MACD Histogram)虽然已处于零轴以下,不过振荡指标下滑的速度有减低的迹象,所以接下来若振荡指标形成一个圆底(Rounding Bottom)的话,综指的短期走势将有望开始上扬。

综指继续的保持横摆巩固的走势,目前综指处于布林中频带的水平,所以综指的后市仍然未明朗化。以技术而言,综指将继续保持目前的走势,直到布林频带明显的打开为止,届时综指的新走势将是综指处于布林中频带的方向。
OK OK Stop twisting my arm
ZL looking for a technical rebound when FBMKLCI is within
1436 >>> 1440 zone
HAPPY TRADING

BURSA MALAYSIA >>> Morning Outlook 30 Sept 2010

Malaysian Stocks May Turn Lower Again
The Malaysian stock market has finished higher in two of three trading days since the end of the three-day losing streak in which it had declined nearly 25 points or 1.6 percent.

The Kuala Lumpur Composite Index ended just above the 1,460-point plateau, although now analysts are forecasting renewed, if mild, selling pressure at the opening of trade on Thursday.

The global forecast for the Asian markets is mixed with a slight downside bias as investors are expected to lock in gains following recent rallies. Properties and financials are likely to be hit hard, while oil, gold and natural gas stocks should provide support.

DJIA dropped 22.86 points (-0.21%) last nite spooked by European markets and the austerity drive riots. The S&P 500 fell 2.97 pts (-0.26%) while the Nasdaq trimmed 3.03 pts (-0.13%) in lacklustre trading.

The European markets finished mixed and the U.S. bourses were slightly lower, and the Asian markets are expected to follow those leads. The KLCI finished slightly higher on Wednesday as gains from the industrial issues and plantation stocks were pared by selling from the financial sector.

EXERCISE CAUTIONS
MORE CONSOLIDATIONS AHEAD !!!

Malaysia Derivatives Exchange >>> Market Overview

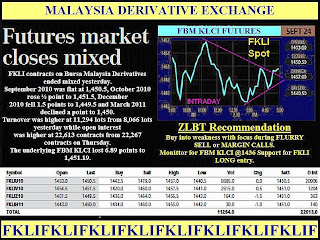
CASH MARKET LIFT FKLI
Consolidations capped the FKLI gains.
This has been anticipated & factored by ZLBT
Careful with exuberant entries >>> NO rushing ok?
Mindset Buy On Weakness preferably during Flurry Selling
HAPPY TRADING

Wednesday, September 29, 2010

WALL STREET >>> Bulls Rallies 46 points To Recoup Yesterday's Losses

DJIA on Buzzer-Beating Buying Spree

Stocks continued their trend of wishy-washy price action today, as investors mulled a mixed bag of data. Right out of the gate this morning, the bears took an early lead on the heels of a discouraging report from the Conference Board, which said that its consumer confidence index fell to a seven-month nadir of 48.5 in September, below economists' predictions.
In addition, a larger-than-anticipated rise in the S&P/Case-Shiller home price index garnered a somewhat muted response, as the figures still hinted at a relatively weak housing market. However, the scales eventually tipped in the bulls' favor, as the Street opted to turn lemons into lemonade. More specifically, stocks extended their lead in the final hour of trading, with investors hoping the day's disappointing data will translate into more stimulus measures from the Federal Reserve. Against this backdrop, the major market indexes resumed their September run higher, with the Dow Jones Industrial Average (DJIA) turning an 80-point deficit into a 46-point gain by the close.

"You have to hand it to the bulls," noted Senior Technical Strategist Ryan Detrick. "The way the market shook off the poor consumer confidence data was rather impressive." What's more, he adds, there could be even more upward momentum in store, as "the longer the S&P 500 Index consolidates its breakout atop 1,130, the more likely this rally will continue."

Thanks to an eleventh-hour buying spree, the Dow Jones Industrial Average (DJIA – 10,858.14) finished with a gain of 46.1 points, or 0.4%, to reclaim its short-lived perch atop the 10,850 level. Only eight of the Dow's 30 components ended in the red, with tech concern Cisco Systems (CSCO) leading the laggards, while Pfizer (PFE) paced the 22 advancing blue chips.
In similar fashion, the S&P 500 Index (SPX – 1,147.70) reversed early losses to end 5.5 points, or 0.5%, higher, though the index's upward trajectory was stopped short at the psychologically significant 1,150 level.
Meanwhile, the Nasdaq Composite (COMP – 2,379.59) added 9.8 points, or 0.4%, by the close, extending its month-to-date advance to an impressive 12.6%.
HAPPY TRADING

Steady CPO Poised To Test Resistance

Malaysian palm oil futures ended firmer Monday on expectations of higher demand and support from external markets. A weaker dollar boosted all commodities across the board. Soya oil futures rose to a new two-year high on good export sales and a possible flood threat in Minnesota, one of the largest growing regions.
Crude oil rose the most in two weeks as the dollar dropped against the euro, bolstering the appeal of commodities. This was despite a "not so rosy" data from the official MPOB in the previous week. Threat of higher production and a possibility of an increase in export tax in Indonesia could continue to cap gains.

CPO futures have been moving perfectly in line with our expectations. As mentioned in the previous update, a direct rise above 2,685 Malaysian ringgit (MYR) a tonne has clearly indicated that the market has ignored all the negative factors. Such a move could now be targeting the next important resistance at 2,865 MYR/tonne. Near-term resistance is at 2,755 MYR/tonne followed by 2,800 MYR/tonne now.


Looking at the soya complex, we believe there could be more upside and a sustained uptrend there. If the bullishness in the soya complex rubs off on CPO, it is unlikely that CPO futures could go down lower despite weak fundamentals. Some volatility could be seen in the coming weeks with important supports at 2,695 followed by 2,655.
We believe the impulse that began from 1,427 MYR/tonne, which hit 4,486 MYR/tonne ended and a prolonged corrective move has possibly ended at 1,335 MYR/tonne. The fresh impulse move, which we have been anticipating towards 3,000-3,200 MYR/tonne could be in progress.


This view gains momentum only on a close above 2,865-70 MYR/tonne. RSI is in the 64.3 [neutral / bullish] zone now, indicating that it is neither overbought nor oversold. The averages in MACD are above the zero line of the indicator indicating the beginning of a strong bullish trend. Only a cross-over below the zero line again could indicate bearishness again. Therefore, look for palm oil futures to test the resistance levels.
At 6.00pm Monday the benchmark December contract ended MYR2 higher at MYR2,737 a metric ton after trading in a narrow MYR2,718-MYR2,752/ton range. Choppy trade emerged during the afternoon session, with some investors taking the opportunity to cover some positions. Some investors also liquidated positions ahead of Thursday's export data by independent surveyors.
Supports are at MYR 2,695, 2655 and 2,575. Resistances are at MYR 2,755, 2,800 and 2,865.
HAPPY TRADING

Tuesday, September 28, 2010

ZLBT Pre-market Charts >>> THe Dow and FBM KLCI

A Red DJIA Followed By A Red FKLI Then A Red FBM KLCI...
Anything else is new?

BUY ON DIP !!!
HAPPY TRADING

BMD Crude Palm Oil Futures

Bullish Remarks & Export Data Lift CPO Prices
Crude palm oil (CPO) futures prices on Bursa Malaysia Derivatives closed at a 15-month high today, spurred by strong biofuel demand and gains in soyoil prices, dealers said.

They said a weakening US dollar as well as favourable export data had also helped to drive CPO prices higher.

Cargo surveyor Societe Generale de Surveillance reported that Malaysian palmoil exports products for Sept 1-25 up 15 per cent to 1.08 million tonnes compared to 939,456 tonnes shipped from Aug 1-25.

An analyst said CPO prices are expected to touch RM3,000 per tonne in the next five months, supported by other edible oils, particularly strong demand for biofuel. However, weather conditions in South America region would play an influential factor in determining vegetable oil prices in coming months, the analyst said.

At close today, the October 2010 contract rose RM21 to RM2,763 per tonne, November 2010 increased RM33 to RM2,732, December 2010 went up RM34 to RM2,735 per tonne and January 2011 added RM37 to RM2,741 per tonne.

Total volume increased to 19,154 lots from 11,516 lots last Friday while open interests declined to 64,731 contracts from 65,708 contracts previously. On the physical market, October South rose RM25 to RM2,765 per tonne.

Monday, September 27, 2010

WALL STREET >>> Sept Window Dressing Climax

DJIA TO TEST SUPPORT IN OCTOBER
Stocks rally as we approach the end of the third quarter, but fund managers may be supporting prices to window-dress their balance sheets. Expect a mid-October retracement (as in 2007) to test the new support level. The Dow broke through resistance at 10700, signaling an advance to 11200 in the short-term. Twiggs Money Flow (13-week) respect of the zero line indicates buying pressure. The long-term target for a breakout above 11200 would be 12700*, but it would be prudent to wait for retracement in October to confirm the new support level (at 10700).
M&A activities to boost The Dow Monday opening.
Wall Street Rally set to continue ...
HAPPY TRADING!!!

MDEX >>> FKLI Recommendations

Please click image to ENLARGE
ZLBT mindset remains LONG / BUY for Q3 with intermediate profit takings and pullbacks in-between.
That is nothing but the norm.
Monitor FBM KLCI 1436 Support as critical Support reference for FKLI
GOODLUCK2ALL

Oil Prices Ready To Gush

Crude futures continued their trek higher last Friday, as a surprise rise in Germany's Ifo index of business sentiment weighed heavily on the U.S. dollar.
The ailing greenback made it cheaper for foreign-currency holders to scoop up the dollar-denominated commodity, with November-dated crude oil futures finishing with a gain of $1.32, or 1.7%, at $76.50 per barrel.
For the week, black gold added 3.8%.

Saturday, September 25, 2010

CPO Rises Against Higher Productions and Lower Exports Data

CPO Moves Higher Against Headwinds
Malaysian palm oil futures ended higher on Friday helped by strength in external markets. This was despite a very weak data from the official Malaysian Palm Oil Board. Strength from the corn futures rubbed-off on all agricultural commodities. Official data on stocks and exports paint a bearish fundamental picture.

End-August CPO inventories rose to 1.72 million tonnes from 1.41 million tonnes in July, data from the government-linked Malaysian Palm Oil Board showed. August output rose 5.7 per cent to 1.61 million tonnes even as exports declined 18 per cent to 1.21 million tonnes. CPO futures have been moving in line with our expectations.

As mentioned in the previous articles, we expected a fall towards 2,585 Malaysian ringgit (MYR) a tonne. CPO futures can be in a choppy range now with good resistance near the 2,745 > 2,785 MYR/ton zone and good supports near 2,550 > 2,600 MYR/tonne zone or even lower to 2,525 MYR/tonne in the coming sessions.


A direct rise above 2,750 MYR/tonne on the other hand would signify that the market has ignored all the negative factors. Such a rise could then target the next important resistance at 2,865 MYR/tonne.
Looking at the soybean oil charts, we believe there could be more upside and a sustained uptrend there. If the bullishness in the soya complex rubs off on CPO, it is unlikely that CPO futures could go down lower despite weak fundamentals. In the big picture bullishness for 2,865 MYR/tonne is still intact as long as 2,500 MYR/tonne remains undisturbed.

We believe the impulse that began from 1,427 MYR/tonne, which hit 4,486 MYR/tonne ended and a prolonged corrective move has possibly ended at 1,335 MYR/tonne.

The fresh impulse move, which we have been anticipating towards 3,000-3,200 MYR/tonne can again be expected. This view gains momentum only on a close above 2,865 > 2.870 MYR/tonne.

RSI is slightly above the neutral zone now, indicating that it is neither overbought nor oversold. The averages in MACD are above the zero line of the indicator indicating the beginning of a strong bullish trend. Only a cross-over below the zero line again could indicate bearishness again. Therefore, look for palm oil futures to consolidate and then rise higher.

Supports are at MYR 2620, 2585 and 2,550.
Resistances are at MYR 2,700, 2745 and 2,785
HAPPY TRADING FOLKS

WALL STREET >>> DJIA Defeats 10850 Level

Bulls Come Back with a Vengeance
Stocks resumed their September run higher today, with encouraging data from across the pond providing an early lift.
More specifically, Germany's closely watched gauge of business sentiment unexpectedly rose to a three-year peak in September, easing concerns about the fiscal health of the euro zone. On the home front, though, the Street had its own dose of upbeat data to celebrate, courtesy of the Commerce Department. Along with an upwardly revised reading for durable-goods orders in July, Uncle Sam said orders for core capital goods rose 4.1% in August, compared to a decline of 5.3% in the month prior. The latest figures pointed toward improving capital spending habits among U.S. businesses, and helped to overshadow a relatively lackluster housing report.

Against this backdrop, the Dow Jones Industrial Average spent the session basking in triple-digit-gain glory, with the major market indexes extending their winning streak to four straight weeks.

"So much for falling back into the range," commented a senior Wall Street dealer. Referring to the recent crop of solid earnings reports, most analysts said they are encouraged that the broad-market rally could have more gas in the tank.
"If this is a preview of the upcoming third-quarter earnings season, we could be in for more solid data – which would confirm that all the talk of a double-dip recession was extremely overblown," he said.

The Dow Jones Industrial Average (DJIA – 10,860.26) skyrocketed nearly 198 points, or 1.9%, today, marking the blue chips' best session since Sept. 1. In fact, all of the Dow's 30 components settled north of breakeven, with Caterpillar Inc. (CAT) paving the path higher on the heels of a price-target boost from Credit Suisse. Thanks to today's triple-digit surge, the Dow not only reclaimed its foothold atop the 10,700 level, but also finished atop the 10,850 level for the first time since mid-May. For the week, the blue chip barometer tacked on 2.4%, extending its month-to-date advance to 8.4% - on pace for the best September in 71 years.

In similar fashion, the S&P 500 Index (SPX – 1,148.67) rallied 23.8 points, or 2.1%, though the index's surge was stopped short at the 1,150 level.

Meanwhile, the Nasdaq Composite (COMP – 2,381.22) fared the best of the three, tacking on an impressive 54.1 points, or 2.3%, to end its second consecutive week atop its 20-week trendline. For the week, the SPX gained 2.1%, while the tech-rich COMP powered 2.8% higher.
HAPPY WEEKEND2ALL

Friday, September 24, 2010

TECHNICAL ANALYSIS >>> 综合指数 2010年 09月 24日/FBM KLCI 24/09/2010

综合指数 2010年 09月 24日
如图中箭头A所示,富时综合指数开市出现5.06点的下跌缺口(Gap),综指随后一度下探至1445.33点的全日最低水平,惟综指在闭市时回弹,收窄跌幅,以1451.19点闭市,按日下滑6.89点。综指当前的支持水平是1436及1424点的费氏线,阻力水平则是1480点的费氏线。

如图所示,综指跌破布林中频带(Bollinger Middle Band),这显示综指有转弱的迹象,惟布林频带(Bollinger Bands)目前处于收窄的状态(-11%),所以综指目前只是属于一个调整的格局,并未确认为跌势,直到布林频带重新打开为止。

如图中箭头B所示,马股的成交量暴涨72.8%,并且创下8个月来的新高水平,这显示虽然市场出现调整,尤其是蓝筹股项,不过投资者继续回笼,这使到市场交投量高。所幸的是综指并未大举下跌,所以成交量稍高并不算是加剧了综指的跌势。

如图中箭头C所示,随机指标(Stochastic)跌破50%的水平,这显示综指的短期走势的确是处于下跌的格局。接下来若随机指标跌破30%,那将是综指确认形成短期跌势的讯号,换句话说,随机指标必须短期内回弹,综指的短期走势才有望避免进入下跌的趋势。

总的来说,综指的短期走势有形成跌势的迹象,惟成交量却增加,显示市场交投活跃,投资者也有转向非综指成份股的迹象。以中长期来看,综指仍然获得14、21、31天加权移动平均线(EMA)的支持,所以综指仍然属于上扬的格局;综指目前只能算是处于短期的调整格局.

FBM KLCI 24/09/2010
As indicated by A, the FBM KLCI opened gap down of 5.06 points on Friday, and had its intra-day low reaching 1445.33 points, but the KLCI managed to regain some of its losses to close at 1451.19 points, losing 6.89 points for the day. Resistance for the FBM KLCI is at 1480 level while the support are at 1436 followed by 1424 WinChart Automatic Fibonacci Retracement.

As shown on the chart above, the KLCI fell below the Bollinger Middle Band, with the immediate technical outlook turning slightly negative, however, the Bollinger Bands is contracting, thus suggesting that the KLCI might be consolidating, until the Bollinger Bands should re-expands.

As indicated by B, total market volume surged 72.8%, which marked an 8 months new high. This suggests some increased of bargain buying despite profit taking activities, and fortunately, the KLCI losses for the day was rather mild, thus there are no panic selling detected yet.
However, if the KLCI should start falling again, with huge volume, the selling pressure is likely to increase.
As indicated by C, the Stochastic break below 50%, suggesting that the KLCI short term is weakening. If the Stochastic should break below 30%, it would be a short term bearish signal for the KLCI.
In conclusion, the KLCI might be losing strength, but for the mid to longer term view, the uptrend remains intact with the 14, 21, 31 EMA still supporting the KLCI. Therefore, the recent retreat of the KLCI is only a technical correction.

HAPPY WEEKEND2ALL

Thursday, September 23, 2010

ZLBT Currency Select >>> The Yen

Price action on USD/JPY (a 4-hour chart of which is shown) as of Tuesday (9/21/2010) has, for the time being, respected the confluence of resistance at: the 86.00 level and the key downtrend resistance line extending from the 2010 high hit in May.

Therefore, despite the substantial bullish move that occurred last week, the fact that price has tentatively respected this resistance confluence with a bearish bounce indicates that the pair is technically still within the confines of a longer-term downtrend. Whether this downtrend continues or not is largely dependent upon whether price breaks down further to breach 85.00 significantly. If this becomes the case, price could potentially go on to target the support lows around 83.00 once again. In the event of a strong subsequent upside breach of the noted 86.00 resistance, a key further resistance target resides around the important 88.00 price region.
HAPPY TRADING

FBM KLCI Futures >>> Market Overview

FKLI Bears Hug The Bulls >>> Finally
What a bad day for FKLI LONG traders >>> ZL included :(
Spot (Sept) dived 25.5 points and when was the last time you saw such a red candle? Anyway it's been a long time coming.
It had to happen and happened it did today. YO!

For knife catchers & bargain hunters, becareful of the dominant ok?
You are looking at one big mean Mama Grizzly.
Show some respect if you wanna trade longs ......

"When a 800 kg Grizzly comes charging at you >>>
Don't move, don't blink & don't even breathe
Best option >>> Play Dead"

To All FKLI Shorters >>> CONGRATULATIONS!
Seize the moment
MAKE HAY WHILE SUNSHINE

BURSA MALAYSIA >>> Morning Outlook

Malaysian Stocks May Extend Losses
The Malaysian stock market lost just a point on Wednesday - but that was enough to halt the two-day winning streak in which it had collected nearly 10 points or 0.6 percent. The Kuala Lumpur Composite Index ended just below the 1,475-point plateau, and now investors are bracing for additional softness when the market kicks off trade on Thursday.

The KLCI finished barely lower on Wednesday as weakness from the plantation stocks and industrial issues was pared by gains from the financial sector.

For the day, the index eased 1.24 points or 0.08 percent to finish at 1474.75 after trading between 1,474.73 and 1,479.44. Volume was 1.332 billion shares worth 2.021 billion ringgit. There were 398 gainers and 363 decliners, with 280 stocks finishing unchanged.Among the actives, Maybank, Kuala Lumpur Kepong, IOI Corporation and Tenaga Nasional all finished lower, while Sime Darby was unchanged and Gamuda, MMC Corporation, YTL Corporation and CIMB ended higher.

In economic news, Malaysia's consumer price index rose 2.1 percent year-on-year in August, the Department of Statistics said on Wednesday, faster than a 1.9 percent rise in the previous month. Economists had expected a rate of 2 percent.Month-on-month, consumer prices grew 0.4 percent in August, following a 0.3 percent rise in July. Food & non-alcoholic beverages prices rose 0.3 percent and restaurants & hotels costs climbed 0.2 percent. In the January to August period, the CPI increased 1.5 percent compared to the same period of the previous year.

Also, Malaysia's international reserves were at US$95.9 billion as on September 15, larger than US$95.2 billion as on August 30, the Bank Negara Malaysia said on Wednesday.

Foreign currency reserves amounted to US$85.7 billion, slightly up from US$85.1 billion as on August 30. Meanwhile the value of other reserve assets was at US$6.3 billion, unchanged from the previous period.The IMF reserve position was at US$0.4 billion, same as in the previous period. Gold reserves and Special Drawing Rights amounted to US$1.5 billion and US$2 billion, respectively, the central bank said.

HAPPY TRADING

Wednesday, September 22, 2010

Harga Minyak Sawit Mentah Naik Pada Faktor Eksternal; Kebimbangan Cuaca

Minyak mentah sawit di Bursa Malaysia Derivatives Exchange berakhir Rabu kebanyakan lebih tinggi dari dengan tindakan pelabur menutup posisi pendek beliau memuat dari harga lebih tinggi minyak krud dan soyoil kontrak hadapan.

Kontrak benchmark Disember berakhir MYR3 tinggi pada MYR2, 673 per metrik tan selepas perdagangan dalam kisaran sempit MYR2 MYR2, 659 -, 694/ton. Perdagangan sedikit berombak semasa sesi awal di tengah tidak adanya pembeli China, sebagai pasaran di China ditutup untuk bercuti kebangsaan tiga hari.

Tapi harga naik lebih banyak di kemudian hari, kerana kebimbangan bahawa curah hujan di Indonesia dan Malaysia bisa basah prospek tanaman kelapa sawit September. curah hujan lebih berat dari biasanya menyertai cuaca La Nina peristiwa dalam beberapa minggu terakhir telah menghalang pengangkutan buah sawit di wilayah sawit besar di Indonesia yang menghasilkan minyak dari Kalimantan tengah kekurangan pekerja selama bercuti baru-baru ini, petani Indonesia dan kata para peniaga.

Seorang petani yang berpusat di Jakarta dengan perkebunan sawit di Kalimantan Barat dan Selatan mengatakan jalan paling terkemuka keluar dari perkebunan kepada kilang-kilang dan kilang telah dipengaruhi oleh hujan lebat. Beberapa petani di Malaysia, pengeluar kelapa sawit terbesar kedua di dunia selepas Indonesia, berkata pengeluaran di negara bahagian Sabah kemungkinan akan mengalami penurunan 2% -5% pada bulan September dari 479.973 ton pada bulan Ogos, memberikan tekanan ke atas harga Namun, setiap penurunan pengeluaran kelapa pada bulan September kemungkinan untuk sementara sebagai kitaran tuaian di kebun, yang berlangsung 10-15 hari, diharapkan dapat meneruskan dengan bulan depan sebagai pekerja-pekerja ladang kembali dari bercuti Aidil Fitri.

Meskipun demikian, permintaan import mantap dari India, yang lain pelanggan utama minyak nabati, harus membawa beberapa bersorak ke pasar. "Setakat pengeluaran biji minyak (di India) yang bersangkutan, output (dari kacang tanah dan kacang soya) yang diharapkan melebihi paras 2009-2010. Walaupun pengeluaran akan lebih tinggi, minyak sayur import keperluan (untuk tahun ini) akan meningkatkan sekitar 400,000-500,000 tan, "kata Govindlal Patel, partner pelaksana di India yang berpusat import minyak nabati Syarikat Dipak Enterprise.

Dia juga berkata penurunan import minyak bunga matahari kerana harga antarabangsa yang lebih tinggi akan meningkatkan permintaan minyak sawit.


India mengamankan minyak sawit dari Indonesia dan Malaysia dan mendapatkan minyak bunga matahari dari Argentina dan Brazil. "Saya menduga import minyak sawit (tahun ini) akan naik sekitar 700,000 tan, manakala import minyak bunga matahari hanya akan mencapai 400.000 ton," ujar Patel.

Kargo olein sawit untuk Januari / Februari / Mac tersenarai dalam $ 900/ton, tidak berubah dari harga hari Selasa tersenarai. April / Mei / Jun kargo tersenarai dalam $ 900/ton dan $ 902.50/ton, tidak-on-board pelabuhan Malaysia, kata seorang eksekutif perniagaan yang berpusat di Singapura.

Cash CPO untuk penghantaran akan ditawarkan di MYR2 MYR10 rendah, 740/ton. Dolar AS dalam mata wang CPO Disember sawit kontrak Globex tersenarai dalam $ 868/ton, $ 5,25 lebih tinggi dari dekat di 0.947 Selasa GMT.

Kontrak November kelapa sawit dalam mata wang ringgit pada Komoditi Indonesia dan Kesan derivatif perdagangan 0,1% lebih rendah di IDR7, 805/ton pada 0947 GMT. Buka bunga pada BMD itu banyak 66.009 66.630 banyak dibandingkan dengan Selasa, sementara kelantangan tersenarai naik menjadi 14.279 dari 11.961 banyak banyak. Satu lot setara dengan 25 tan.

Transaksi derivatif Malaysia migrasi ke elektronik

Bursa Malaysia Derivatives berhasil melakukan migrasi seluruh transaksi kontrak derivatif ke platform transaksi elektronik CME Group yakni CME Globex. Migrasi ini dilakukan pada 20 September 2010 hingga tengah malam waktu Kuala Lumpur.Siaran pers CME yang diterima Bisnis pagi ini disebutkan produk yang paling utama yang di migrasikan yakni kontrak berjangka minyak kelapa sawit mentah (FCPO), yang merupakan produk unggulan Bursa Malaysia dan menjadi harga patokan CPO internasional bersama-sama dengan CPO di CIF Rotterdam Belanda.

Dengan migrasi seluruh produk kontrak berjangka milik Bursa Malaysia Derivative ke platform transaksi elektronik CME Globex ini memberi kemudahan akses bagi trader dan investor global untuk bertransaksi ke Bursa Malaysia.

Luasnya akses trader internasional ini karena dapat diakses pada 9 jaringan telekomunikasi internasional, salah satunya berada di Kuala Lumpur.

Bursa Malaysia Derivatives akan tetap mengoperasikan dan meregulasi pasar terkait jam transaksi, produk, spesifikasi, definisi margin, dan harga, sedangkan CME Globex hanya mendukung berlangsungnya transaksi.


Jam perdagangan di Bursa Malaysia Derivatives untuk kontrak berjangka derivatif tidak berubah. Seluruh kontrak di bursa ini ditrannsaksikan pada platform transaksi elektronik CME Globex.Untuk kliring dan penjaminan masih ditangani Bursa Malaysia Derivatives Clearing Berhad, perusahaan kliring yang menjadi subsidiari Bursa Malaysia Derivatives. Bursa Malaysia Derivatives dan CME Group sebelumnya sudah menjalin kerjasama untuk transaksi kontrak berjangka CPO pada Mei 2010.

CME memperdagangkan kontrak berjangka CPO dengan produk dasar milik Bursa Malaysia Derivatives, namun berdenominasi dolar AS. Penyelesaian transaksi hanya bersifat cash settlement, tidak ada serah fisik CPO.

WALL STREET >>> Bulls Nose Out The Bears

DJIA Ekes Out a Win as Fed Stands Pat
The Dow closed slightly higher as policymakers vowed to keep interest rates low


Stocks spent most of the day languishing below the breakeven line, as traders braced themselves for the Federal Open Market Committee's (FOMC) monthly decision on monetary policy. The group's statement hit the Street around 2:15 p.m., with the FOMC reiterating its now-familiar pledge to keep interest rates at exceptionally low levels for an extended period of time. The announcement sent the major market indexes jolting higher -- right in step with sole dissenter Thomas Hoenig's blood pressure, most likely -- and equities spent the session's final hour cautiously exploring positive territory.

"We held the 1,130 breakout on the S&P 500 Index," observed Senior Technical Strategist Ryan Detrick. "But even more important is where we are finding leadership in this market. The consumer discretionary sector has been doing great recently," he explained, "so all the talk about the consumer being tapped out might not play out the way the bears expected."

The Dow Jones Industrial Average (DJIA – 10,761.03) was able to maintain only a fraction of its post-Fed momentum, ending up 7.4 points, or 0.07%. Sixteen of the Dow's 30 components closed higher, led by Caterpillar, while commodity concern Alcoa paced the 14 decliners. The blue chip barometer might not have made any major moves today, but the Dow did solidify its newfound foothold above former resistance at 10,700.

The S&P 500 Index (SPX – 1,139.78) couldn't maintain its grip on positive territory, settling for a daily deficit of about 3 points, or 0.3%. However, as Detrick noted, the SPX remains perched above the key 1,130 level, which served as a technical ceiling throughout the summer.


Finally, the Nasdaq Composite (COMP – 2,349.35) followed suit with the SPX by giving up 6.5 points, or 0.3%, after making the briefest of trips above the breakeven line in afternoon trading.


CRUDE OIL FUTURES
Crude futures ended lower today, as the FOMC warned of a persistently sluggish economic recovery. Against the backdrop of remarkably bloated oil inventories, the central bank's cautious forecast didn't exactly bode well for future energy demand. However, simultaneous weakness in the U.S. dollar helped the front-month contract pare the worst of its losses. By the close, crude oil for October delivery shed $1.34, or 1.8%, to finish at $73.52 per barrel.

GOLD FUTURES
]Gold futures finished trading ahead of the FOMC announcement, closing a relatively quiet session on a loss of $6.50, or $0.5%, at $1,274.30 per ounce. The contract made up for lost time in after-hours trading, though, with gold for December delivery surging higher as traders rushed to stock up on the popular inflationary hedge. In electronic trading, gold jumped as high as $1,290.40 per ounce -- well north of Monday's freshly tapped record peak.
HAPPY TRADING

TECHNICAL ANALYSIS >>> 综合指数 2010年 09月 21日/ FBM KLCI 21/09/2010

综合指数 2010年 09月 21日
如图中箭头A所示,富时综合指数一度上扬,惟再度的在1479.59点的水平遇阻,综指全日稍微上扬6.30点,以1475.99点闭市,综指当前的阻力依然是1500点的心理阻力关口,支持水平则是1436及1424点的费氏线。

如图所示,布林频带(Bollinger Bands)打开7%,而综指又继续的处于布林中频带(Bollinger Middle Band)以上,使到综指再度的上扬,以布林频带来看,综指将继续保持偏强目前的走势,直到综指跌破布林中频带为止。

如图中箭头B所示,马股的成交量增长23.4%,所以成交量成功的处于40天成交量成交量移动平均线(VMA)以上,这表示马股整体市场相当活跃,这活跃的交投量将有助于综指继续转强。

如图中箭头C所示,随机指标(Stochastic)上扬,使到随机指标自8月13日以来一直保持在70%以上的水平,这显示综指一直都处于一个短期上扬的格局。这也意味着综指将保持在短期的涨势,直到随机指标跌破70%为止。

总的来说,综指保持在布林中频带以上,再加上随机指标高于70%,所以综指属于上扬的格局,惟布林频带打开的幅度不大,所以综指上扬的幅度亦比较小。另一方面,综指的中长期走势仍然获得14、21、31天加权移动平均线(EMA)的扶持,所以仍然属于上扬的格局,直到综指跌破此EMA为止。

FBM KLCI 21/09/2010
As indicated by A, the FBM KLCI rebounded on Tuesday, but still resisted by the 1479.59 level, gainig 6.30 points to close at 1475.99 point.
Resistance for the KLCI remains at 1500 while the support is at 1436 followed by 1424 WinChart Automatic Fibonacci Retracement.
As shown on the chart above, the Bollinger Bands expanded 7%, with the KLCI above the Bollinger Middle Band, thus the immediate technical outlook for the KLCI is still bullish biased. If the Bollinger Bands should continue to expand with the KLCI above the Bollinger Middle Band, more upside movement is expected for the KLCI.
As indicated by B, total market volume increased 23.4%, with volume above the 40-day VMA level, suggesting that the market is well-participated. Basically, if volume should stay above the 40-day VMA level, the market sentiment as a whole is likely to be positive.

As indicated by C, the Stochastic is still above 70%, in the short term bullish region, since 13th of March. This suggests that the short term movement of the KLCI is still bullish biased, until the Stochastic should break below 70% level.
In conclusion, the uptrend of the KLCI remains unaffected, while the 14, 21, 31 EMA is still serving as a long term dynamic support for the KLCI, despite the KLCI upside volatility of the KLCI is slightly reduced.
HAPPY TRADING