ZLBT Chats

Wednesday, October 31, 2012

Technical Analysis : FBM KLCI 2012-10-30 / 富时大马综合指数 2012-10-30

FBM KLCI 30 Oct 2012
As indicated by A, the KLCI successfully stayed above 1668 on Tuesday, gaining 2.11 points to close at 1674.67 points. The temporary resistance for the KLCI remains at 1679 ~ 1680 level, while the 14, 21, 31 EMA is still serving as the dynamic support to the KLCI.
 
As indicated by B, total market volume fell 12.33%, but volume stays above its 40-day Volume Moving Average. This shows that the overall market is still actively participated, relatively. Meanwhile, losers outnumbered gainers with 292 gaining while 384 losing. This implies that profit taking is slightly strong on Tuesday.
 
As indicated by C, the Stochastic stays above 70%, thus the short-term bullish signal remains intact, suggesting that the short-term movement of the KLCI is still positive.
 
In conclusion, despite the KLCI closing at yet another historical closing high, stronger profit takings is still dominant with numbers of losing stocks more than rising stocks. Also, the turnover value fell 16%, with RM 1,166 millions, this suggests that investors are generally being cautious while locking in some of their profits. Nevertheless, the immediate technical outlook of the KLCI remains positive, as the uptrend is still intact.
 
富时大马综合指数 2012-10-30
如图中箭头A所示,富时大马综合指数站稳在1668点以上,周二上扬2.11点以1674.67点挂收。综指暂时的阻力落在1679  1680 点的水平,支持水平还是142131EMA的动态支持线。
 
如图中箭头B所示,马股总成交量减少了12.33%,不过成交量还是达到40天的成交量平均线(VMA)的水平。这表示市场的交投还算是活跃的。另一方面,马股周二下跌股项超过升股(292只涨/384只跌),这暗示着周二投资者套利的活动是稍微的偏高。
 
如图中箭头C所示,随机指标(Stochastic)继续维持在70%的水平,这表示综指短期的走势还是维持在强势中,直到随机指标跌破70%水平为止,届时才是短期强势结束的讯号。
 
总的来说,虽然综指周二写下历史收市新高,但是下跌股项却比上升股来得多,同时市场总交易值也比周一的减少了16%,达11亿6632万令吉。这意味着投资者处于谨慎而套利。无论如何,综指目前的技术展望依然维持在正面,同时还是维持在涨势中。
 
祝你好运
 

Monday, October 29, 2012

ZLBT Random Stock Pick >>> BORNOIL (7036)

Chance For a Breakout
GOODLUCK

Saturday, October 27, 2012

QE 3.5 >>> A SUPERSIZE STIMULUS TO SPEED UP U.S. ECONOMIC GROWTH?

This could happen after the U.S. Presidential Elections
TO ENLARGE .... right click on image; click "open in new tab"
GOODLUCK

Friday, October 26, 2012

Technical Analysis FBMKLCI 25 Oct 2012

 
Additional Volume Vital To Sustain Breakout
As shown in the chart,  the FBMKLCI successfully closed above 1670.16, making a historical closing high at 1671.89 points, gaining 3.9 points. The SMA 20-day remains its dynamic support for immediate term. Since the FBMKLCI is closing at its historical high, there is no reliable resistance for now. No man's land is unknown territory.
 
As indicated by the 50-day Volume Moving Average, total market volume increased 27.2%, with 31,440,328,900 shares traded. Market sentiments should remain optimistic if daily traded volume stays  above the 50-day VMA. Generally, the active market participation is likely to sustain the improving market sentiment.
 
The daily Stochastic stays above 70%, in its short-term bullish territory, suggesting that the short-term movement of the FBMKLCI is still positive.
 
In conclusion, despite the US market closing at recent month lows, the FBMKLCI marks its historical new high. Technically, the technical outlook for the FBMKLCI remains positive, as it is still supported by the rising 14, 21, 31 EMA dynamic support (not included in this chart).
 
HAPPY HOLIDAYS
 

SELAMAT HARI RAYA AIDILADHA
daripada ZLBT

Thursday, October 25, 2012

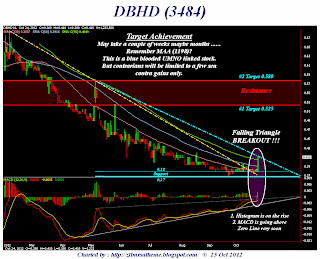
ZLBT Random Stock Pick 25 Oct 2012 >>> DBHD (3484)

GE 13 Short-term Trade
DBHD (3484)
Chart Analysis
An important development took place on 24 October 2012 where the price of DBHD broke the resistance of 0.39. This breakout was accompanied by a higher than average traded volume which shows the enthusiasm of the traders to push the price higher and past this resistance hence giving a higher probability of a successful breakout. DBHD close 0.41 with a +0.025 gain on increased volume.
 
Recommend BUY ON WEAKNESS (Red prices only)
Cutloss 0.38 > 0.37
Target : 0.525 & 0.580
 
GOODLUCK

Wednesday, October 24, 2012

Top 20 UPPER BOLLINGER BAND BREAKOUT stocks for your perusal 24 Oct 2012

*Note: As for the top 20 breakdown list below, the sole sorting criteria is stock price must close significantly BELOW the lower Bollinger Band, with the largest distance from the lower band at the top of the table, signaling a severe sell-off which is bearish.
 
Caveat: A stock should bottom out if share price moves ABOVE the falling lower Bollinger Band, which can be a good buy signal for technical rebound upside after the sharp sell-off.

DISCLAIMER

The information contained herein was obtained from sources believed to be reliable. However, we do not guarantee the accuracy and completeness of the report. Opinions expressed herein are subject to change without notice. This report is for information purposes only and should not be construed as an invitation, offer or solicitation to purchase or sell any futures product referred to herein. The Author may from time to time has an interest or position in the futures products or stocks mentioned. There is a risk of loss in trading stocks,futures & derivatives like products.
 
GOODLUCK

Saturday, October 20, 2012

WALL STREET 20 Oct 2012 >>> Dow Swallows Huge Losses On Bleak Blue-Chip Earnings

Parabolic SAR follows price and can be considered a trend
 following indicator. SAR can act like a trailing stop.
Once an uptrend reverses and starts down, stops
continuously falls as long as the downtrend remains

 in place. The SAR dots have yet to appear at the
Extreme Point (Top) of the above chart.
 
DOW SLAMMED BY WEAK EARNINGS
The Dow Jones Industrial Average (DJIA)  spent the session wallowing in the red, suffering a triple-digit slide and erasing nearly all of its weekly surplus by the close. The (DJIA – 13,343.51)  blazed a steady trail lower today, surrendering 205.43 points, or 1.52%, to pare its weekly gain to just 0.1%. As a result of its worst single-session drop in four months, the blue-chip barometer ended beneath its 50-day moving average for the first time since July 12. Of the Dow's 30 components, only Home Depot (NYSE:HD) bucked the trend, tacking on 0.2%. Of the 29 declining equities, McDonald's (NYSE:MCD) suffered the worst, giving up 4.5% in the wake of disappointing earnings. DJIA had it's weekly surplus shaved to 0.1%.

Likewise, the S&P 500 Index (SPX – 1,433.19) steepened its losses as the session progressed, falling 24.15 points, or 1.66%, before finding a foothold in the 1,430 region. For the week, the SPX edged 0.3% higher. Meanwhile, a batch of lackluster earnings in the tech sector weighed on the Nasdaq Composite (COMP – 3,005.62), which plunged 66.78 points, or 2.17%, to finish at its lowest point since Aug. 6. However, the index maintained its perch atop the round-number 3,000 marker. For the week, the COMP gave up 1.3%.
 
ANALYSTS' QUOTES
 
“And once you get one quarter of negative earnings, it’s a precursor. It’s the cockroach theory: If you find one, there’s probably many more.”

"Today was all about earnings. The reality is we're in the second inning and earnings have stunk. We'd better put our 'rally caps' on and hope earnings come in a lot better next week, or the recent weakness could very well continue."

“We’ve had some household names disappointing on revenue, earnings or guidance. We had about 80 companies reporting this week: financials that did better and technology that did worse. Since this is the worst day we’ve had in months, it reminds us that we haven’t had much volatility or downward pressure since the bottom in June.


“The earnings season is not great right now, but the fundamentals haven’t changed; the U.S. economy is still improving, and it hasn’t gotten worse in Asia or Europe. The market is taking a pause.”

"Poor corporate earnings reports pounded the market today, in a sour end to an otherwise strong week of trading. Disappointing results from three giants of the Dow _ Microsoft, General Electric and McDonald’s _ were to blame. But the broader market fell, too, and the Standard & Poor’s 500 index fared even worse in percentage terms."

HAPPY WEEKEND

Friday, October 19, 2012

Technical Analysis : FBMKLCI 19/10/2012 / 富时大马综合指数 2012-10-19

富时大马综合指数 2012-10-19
富时大马综合指数在活跃的交投的推动之下,在周五的确上探了1668点的阻力水平。综指盘中一度上涨至1670.16点的全日最高,写下来历史新高。不过,由于投资者套利的缘故,综指最后还是无法在突破1668的水平,只能以1666.35点挂收,按日微扬0.93点或0.06%。因此1668点继续是综指目前的阻力水平,至于支持水平方面就是图中所示的142131EMA动态支持线。
 
如图中箭头B所示,马股总成交量周五增加了6.27%,继续处于40天的成交量平均线(VMA)以上。这表示市场的交投果真活跃起来了。不但如此,市场交易总值也增加了42.5%,达21亿8600万令吉,写下了马股3个月的交易总值新高。这表示投资活跃交易的不只是低价股而且还有许多的蓝筹股项,其中包括了马电讯(TM)与亚通(Axiata)。
 
如图中箭头C所示,随机指标(Stochastic)继续处于70%的水平以上,这表示综指短期依然维持在偏强的格局中。
 
总的来说,虽然马股周五交投量与交易总值都偏高,但是美中不足的偏偏是下跌股项明显多过上升股(409只跌 / 294只起)。因此,这反而反映出偏高的交投量与交易市值是投资者活跃套利所致。主要原因是因为综指正在试探1668点的重要阻力水平,投资者在保持谨慎之下选择避免在周末持票才套利离场。无论如何,就算是套利活动活跃,也不影响综指目前正面的技术展望,这是因为综指继续获得142131EMA动态支持线的扶持。
 
FBM KLCI 19 Oct 2012
As indicated by A, the FBMKLCI tested the 1668 resistance with strong volume on Friday, with its intra-day high reaching 1670.16 points, making yet another historical new high. However, due to strong profit takings, the FBMKLCI failed to close above 1668 and only closed at 1666.35 points, gaining only 0.93 of a point or 0.06%. Therefore, the immediate resistance for the FBMKLCI is still at 1668 while the support is the 14, 21, 31 EMA dynamic support.
 
As indicated by B, total market volume increased 6.27%, with volume above the 40-day Volume Moving Average. This shows that the market is actively participated. Not only that, the market turnover value also increased 42.5%, hitting RM 21.86 Billion, which is the highest in 3 months. This suggests that not only low-priced stocks are actively traded, there were some blue chips as well, which includes TM, and Axiata.
 
As indicated by C, the Stochastic remains above 70%, in the short-term bullish territory. This suggests that the short-term movement of the FBMKLCI is still positive.
 
In conclusion, although the market trading volume and turnover value has increased, losers outnumbered gainers, and this is actually reflecting that profit taking is generally dominant on Friday, as investors are taking caution ahead of the weekend, and choose to take profit on Friday, as they are unsure if the FBMKLCI could successfully break above the 1668 resistance. Nevertheless, despite the slightly stronger selling pressure, the technical outlook for the FBMKLCI remains positive, as the FBMKLCI is still firmly above the rising 14, 21, 31 EMA dynamic support.
 
HAPPY TRENDING & GOODLUCK

ZLBT Random Stock Pick >>> REDTONE 0032

WELL SUPPORTED BY SMA 10
Fundamentally, REDTONE not very rosy
but technically very sound.
 
GOODLUCK

FKLI 19 Oct 2012 >>> Strong Resistance At The Top

BULLS vs BEARS
It'll be brutal
HAPPY TRENDING & GOODLUCK

WALL STREET 19/10/2012 >>> Weak Tech, Soild Housing; Stocks End Day On Sour Note

Google & Microsoft Miscued;
Tech Sector Drags Down DJIA
The Dow traded in positive territory several times today, but headed south after lunchtime, finding its first loss in the past five sessions.
The Dow Jones Industrial Average (DJIA – 13,548.94) spent time on both sides of breakeven today, seeing an intraday high of 13,588.73, and a session low of 13,510.93. But by the time the dust settled, the Dow found itself down 8.06 points, or 0.06%. American Express Company's (NYSE:AXP) earnings-related deficit of nearly 3% headed the index's 11 underperforming issues, while The Travelers Companies, Inc. (NYSE:TRV) gained 3.6% on a better-than-expected quarterly report, pacing the 18 winning blue chips. The Procter & Gamble Company (NYSE:PG) remained unchanged.

Both the S&P 500 Index (SPX – 1,457.34) and Nasdaq Composite (COMP – 3,072.87)turned lower today, ending a their three-session uptrend. The SPX slipped 3.57 points, or 0.24%, while the COMP retreated 31.10 points, or 1%. This worst performance of three benchmarks was highlighted by Google Inc's (NASDAQ:GOOG) & Microsoft Corps (MSFT) "premature" earnings release.
 
The CBOE Market Volatility Index (VIX – 15.03) aka Fear Index edged south by 0.3%, but bounced from its session low of 14.68.
 
ANALYSTS' QUOTES:
 
"Say what you want about technology lagging today. The reality is, tech has performed poorly for nearly a month now. What stood out to me is that housing once again bucked the trend and had a good day. Some wise advice that is easier said than done is to play the trends until they don't work anymore."


"My friends, tech is going down and housing is going up. I have no clue how that will end, but it's reality. And as traders, it's our job to trade the major trends." 


“As we saw in Google’s report, there are lots of high expectations in some of these widely held names, and when they don’t deliver, they can get hit pretty hard.” 
 
“The PC market was challenged this quarter. In addition to a tough economic environment and competitive pressures, OEMs [original equipment manufacturers] drew down their Windows 7 inventory as they began to transition to Windows 8.”
 
”The clear driver on the quarter was PCs, shipments of which declined between 8% and 9%. This hurt Windows as well as Microsoft business division revenue.”
 
 
GOODLUCK & HAPPY TRADING

Thursday, October 18, 2012

FCPO Commentaries and Technical Analysis 18 Oct 2012

FCPO Daily Commentary & Technical Analysis
The FCPO active month contract ended slightly higher on Wednesday as electronic soybean oil prices traded higher during the Asian trading session which had underpinned the FCPO price. At the close, the FCPO price was up 5 pts or 0.20% to 2,471.
Based on the daily chart, the FCPO price traded in a narrow range on Wednesday and it had formed a small negative candle. As we can see in the chart, the trend is still positive as long as the FCPO price is able to stay above the level of 2,360. On the other hand, the price could linger in between the range of 2360-2529 and to rise further, it need to break and closes above the level of 2530.
Referring to the MACD histogram, it is building up in the positive zone. Meanwhile, MACD line is crossing above the signal line where the positive sentiment could be building up. As always, intraday support and resistance levels will be eyed.
Technical indicators
MACD= Positive, ADX= Negative

Intraday technical support & resistance for 18th Oct 2012


1st support 2440-2400; 2nd support 2360
1st resistance 2530; 2nd resistance 2575

GOODLUCK