ZLBT Chats

Thursday, July 22, 2010

Random Charts >>> DJIA FBMKLCI FKLI and FCPO

Uncertain Bernanke Bust The Dow
The Dow suffered a triple-digit selloff on Wednesday as new comments from Fed chief Ben Bernanke reminding Wall Street of the “unusually uncertain” nature of the economic recovery spooked the markets and drowned out a cluster of bullish earnings reports.

Stocks stayed close to the breakeven line through the first half of the session, before embarking on a dramatic decline in afternoon trading. Federal Reserve Chairman Ben Bernanke can take most of the credit for the market's nosedive; in Senate testimony today, he noted that the economic outlook is "unusually uncertain," and central bankers are "prepared to take further policy actions as needed" to support a recovery. "Financial conditions ... have become less supportive of economic growth in recent months," admitted Bernanke. Thanks to the Fed head's sober forecast, traders shrugged off upbeat earnings from the likes of Apple and Morgan Stanley (MS), and fled the equities market in favor of the relative safety of bonds and the U.S. dollar.

The Dow Jones Industrial Average (DJIA – 10,120.53) pared the worst of its intraday decline by the close, but still swallowed a sizable deficit of 109 points, or 1.1%. Only four Dow members closed higher, with Coca-Cola leading the way on the heels of its quarterly report. Meanwhile, financial firms Bank of America and JPMorgan Chase paced the 26 decliners. Despite today's drop, the Dow is still perched just a hair's breadth above its 10-week moving average, which has been toppled only once on a weekly closing basis since April.
The S&P 500 Index (SPX – 1,069.59) followed suit by shedding nearly 14 points, or 1.3%. The SPX's intraday slump was contained by its 20-day moving average, which has provided tenuous support since July 9.

Finally, the Nasdaq Composite (COMP – 2,187.33) gave up 35 points, or 1.6%, to settle back below the 2,200 level. The COMP's slide was contained by the 2,185 region, home to its 20-day trendline.

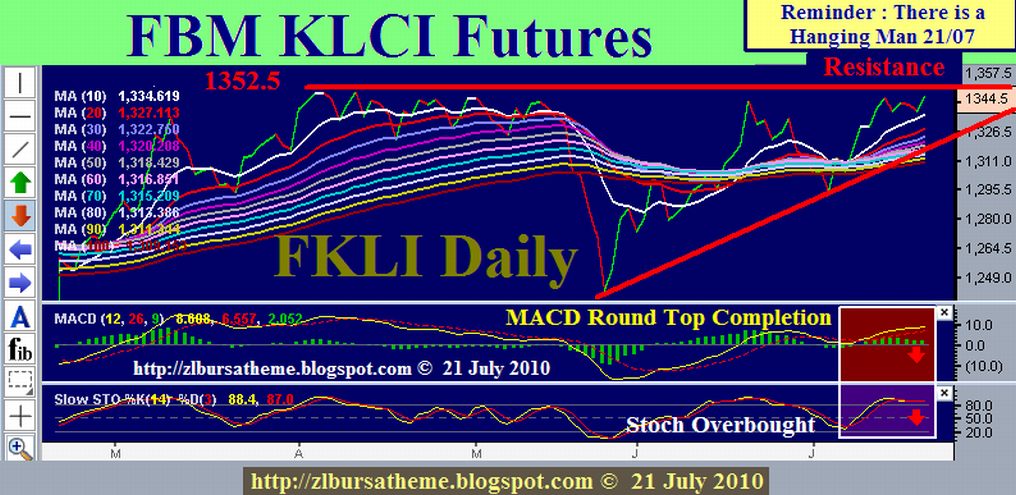
FKLI Recommendation
The appearance of the Hanging Man on 21/07 has U-turned the FKLI sentiments.
SELL INTO STRENGTH / RALLY
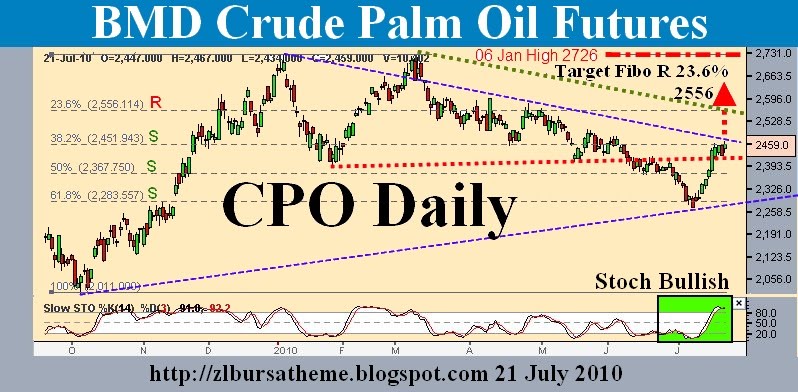
FCPO Recommendation
BUY ON WEAKNESS / PULLBACKS
Preferably during a FLURRY SELL-OFF

Wednesday, July 21, 2010

FBM KLCI Futures >>> Market Overview

FBM KLCI Futures Firmer At Close
The FTSE Bursa Malaysia Kuala Lumpur Composite Index (FBM KLCI) futures contracts on Bursa Malaysia Derivatives closed firmer on Wednesday in line with the uptrend on the cash market, dealers said.

The July 2010 and August 2010 contracts both added 7.5 points to 1,344.5 and 1,344.5 respectively. September 2010 increased 6.0 points to 1,343.0 while December 2010 went up 6.5 of a point to 1,343.5.

Volume was at 5,438 lots, higher than yesterday's 5,319 lots, while open interest increased to 21,046 contracts from 20,617 contracts previously.
On the cash market, the benchmark KLCI index ended 3.35 points higher at 1,341.02.

FKLI Recommendation
BUY ON DIPS

Laporan Pasaran Hiaga Hadapan Minyak Sawit Mentah

MINYAK SAWIT MENTAH (MSM) DITUTUP TINGGI
Pasaran niaga hadapan minyak sawit mentah ditutup tinggi hari ini mendapat rangsangan daripada kekukuhan harga minyak soya dan minyak mentah. Belian menampung kekurangan oleh peniaga juga membantu meningkatkan sentimen pasaran. Minyak mentah berada pada hampir paras tertinggi dalam tempoh tiga minggu pada US$75 setong yang membawa kepada sentimen positif bagi minyak sawit mentah yang kelihatan sebagai pilihan lebih baik bagi sumber biodiesel.
Di pasaran niaga hadapan, Ogos naik RM19 kepada RM2,522 setonne, Sept meningkat RM32 kepada RM2,483, Oktober menambah RM33 kepada RM2,457 manakalaNovember menokok RM32 kepada RM2,452 setonne.
Jumlah dagangan berkurangan kepada 16,473 lot, daripada 17,134 lot semalam manakala kepentingan terbuka naik kepada 68,667 kontrak daripada 67,704 kontrak sebelumnya. Di pasaran fizikal, Selatan Julai meningkat RM20 untuk ditutup kepadaRM2,530 setonne.

TECHNICAL ANALYSIS : Composite Index 21/07/2010 / 综合指数 2010年 07月 21日

Composite Index 20/07/2010
After rebounding from the Bollinger Middle Band, the KLCI gained another 4.32 points or 0.3% on Tuesday, to close at 1337.67 points. Support for the KLCI is at 1325 WinChart Automatic Fibonacci Retracement while the resistance is at 1350.

As shown on the chart above, the Bollinger Bands contracted 16%, suggesting that the KLCI is still consolidating, and the Bollinger Middle Band is still serving as the dynamic support, and the immediate technical outlook is still on the positive side. Meanwhile, the 14, 21, 31 EMA is also serving as a dynamic support for the KLCI.

As indicated by B, total market volume increased 32.7%, with volume above the 40-day VMA level. This suggests that the overall market participation is now improving. Generally, if volume should stay firmly above the 40-day VMA level, the market sentiment is expected to improve.

As indicated by C, the Stochastic rebound and remains above 70%, thus the short term bullish signal remains intact. Generally, the short term movement of the KLCI is likely to stay positive until the Stochastic should break below 70%.

In conclusion, the immediate technical outlook for the KLCI is still positive as it is supported by the Bollinger Middle Band, as well as the 14, 21, 31 EMA. However, the Bollinger Bands has not expanded, thus the KLCI is still consolidating.


综合指数 2010年 07月 20日
富时综合指数自周一在布林中频带(Bollinger Middle Band)继续回弹,综指按日上扬4.32点或0.3%,以1337.67点闭市。综指当前的支持水平仍然是1325点,阻力水平则是1350点的费氏线。

如图所示,布林频带(Bollinger Middle Band)收窄16%,这显示综指处于调整巩固的格局中,目前布林中频带是综指一道重要的动态支持线,因为只要综指能在此线上获得扶持,综指的后市将能继续转强。

除了布林中频带外,14、21、31天的加权移动平均线(EMA)亦是综指重要的动态支持线,通常这是分析师判断综指的后市是向上或向下的一个重要指标。理论上,只要综指继续处于EMA以上,综指的后市将继续看俏,直到综指跌破此EMA为止。

如图中箭头B所示,马股成交量增加32.7%,并且创下3个月的新高水平,这也使到成交量成功的保持在40天成交量移动平均线(VMA)以上,这显示市场交投活跃。此高于40天平均值的成交量若能维持下去,那市场的承接力量将增加,这将有助于综指继续转强。

如图中箭头C所示,随机指标(Stochastic)回弹,这使到随机指标成功的保持在70%以上,以技术而言,综指的短期走势将继续趋强,直到随机指标跌破70%为止。

总的来说,布林频带收窄表示综指目前正在巩固中,这也显示综指正在酝酿着一个新走势。一般上,只要综指接下来能继续保持在布林中频带及14、21、31天EMA以上,那当布林频带开始明显打开时,综指的后市将有望更上一层楼,反之亦然。

Monday, July 19, 2010

Crude Palm Oil Rally Not Sustainable;
Short term Doubts
CPO futures market surged to a six-week high last week, lifted by a mad rush to cover short (sell) positions. The third-month forward benchmark October 2010 futures contract touched a high of RM2,461 a tonne before settling last Friday at RM2,449, up a whopping RM149 or 6.48 per cent over the week. The rush to cover shorts was evidenced by the notable contraction of 3,096 contracts or 4.27 per cent in the total open interest position to 69,473 open contracts, from the previous week's 72,569 open contracts.

There was a fear factor in the rush to cover shorts in a big way - fear that the slew of good and encouraging news would continue to see print and in newswire reports. And concern that world commodity markets, especially the soyabean oil futures market, would extend the length of their past fortnight's strong winning streak. The bellwether US soyabean oil futures market extended its run-up the price chart last week, tacking on 81 points or 2.46 per cent to settle last Friday at 38.31 US cents a pound. Industry estimates of a 2 per cent drop in the September through November US soyabean harvest fuelled soyabean oil's surge to a 14-week high.

The real catalyst for last week's short-covering binge, though, was the latest export estimates. Societe Generale de Surveillance's and Intertek Agri Services' July 1-15 export estimates were figured at a combined average of some 688,000 tons, up a hefty 84,000 tonnes or 13.85 per cent from that for first half June. It was not so much that exports have started picking up, but the realisation that Muslim countries in the Middle East and Pakistan have started buying palm oil in earnest to stock up on cooking oil ahead of the Hari Raya Aidilfitri (end-of Ramadan festive season) that really ignited last week's rally. Hari Raya Aidilfitri, or Eid al-Fitr, is likely fall on September 10.

Conclusion: A rally ramped up by short-covering, no matter how strong, should not inspire confidence as the start to a real bull phase. What is needed is fresh and renewed buying interest, something not apparent - yet. Until that happens playing this market by ear may be the best - and probably only - option.

HOW TO USE THE CHARTS AND INDICATORS
# THE BAR AND VOLUME CHART: This is the daily high, low and settlement prices of the most actively traded basis month of the crude palm oil futures contract. Basically, rising prices accompanied by rising volumes would indicate a bull market.
# THE MOMENTUM INDEX: This line plots the short/medium-term direction of the market and may be interpreted as follows:
(a) The market is in an upward direction when the line closes above the neutral straight line and is in a downward direction when the reverse is the case.
(b) A loss in the momentum of the line (divergence) when prices are still heading up or down normally indicates that the market could expect a technical correction or a reversal in the near future.

# THE RELATIVE STRENGTH INDEX: This indicator is most useful when plotted in conjunction with a daily bar chart and may be interpreted as follows:
(a) Overbought and oversold positions are indicated when the index goes above or below the upper and lower dotted lines.
(b) Support and resistance often show up clearly before becoming apparent on the bar chart.
(c) Divergence between the index and price action on the chart is a very strong indication that a market turning point is imminent.

FCPO Recommendations
SELL INTO STRENGTH / RALLY