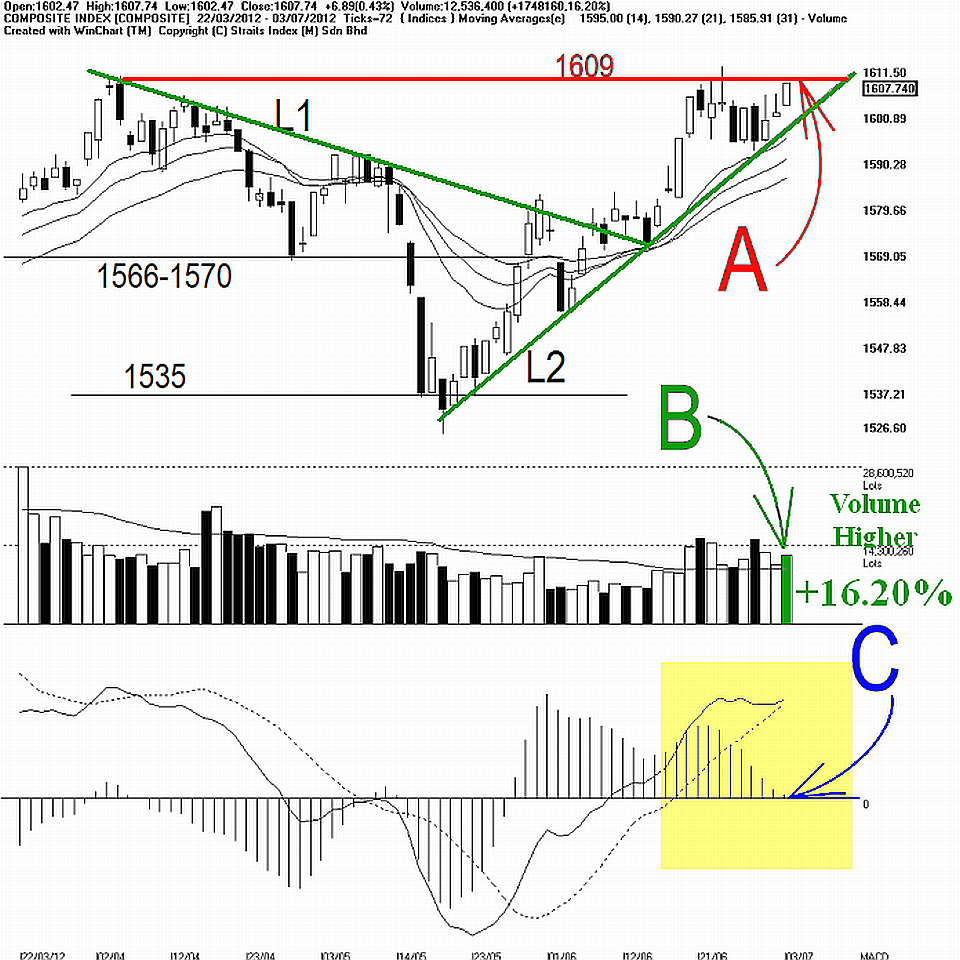
ZLBT Chats

Monday, July 30, 2012

Technical Analysis : 富时大马综合指数 2012-07-30 / FBM KLCI 30 July 2012

富时大马综合指数 2012-07-30
如图中箭头A所示,富时大马综合指数继续获得142131EMA动态支持线的扶持,按日回弹7.41点或0.46%,以1632.35点挂收。虽然综指暂时还未能重返L2线以上,但是只要综指能继续获得142131EMA的扶持而形成较高底(Higher-lows)的话,那综指基本上还是维持在涨势中。综指阻力保持在1647.94点的水平。

如图中箭头B所示,马股总成交量增加了25.58%,使得成交量上扬突破了40天的成交量平均线(VMA)的水平。简单来说,只要成交量能继续维持在40天的成交量平均线(VMA)以上的话,那表示马股整体上的交投是活跃的,而这将有助于综指(或马股整体上)延续上扬格局。

如图中箭头C所示,随机指标(Stochastic)回弹,上扬突破了30%水平而摆脱了短期弱势的区域。以技术而言,这表示综指短期避开了偏弱的格局,目前显示着中立的讯号。若随机指标接下来能上扬突破70%水平的话,那表示综指短期再次进入偏强的格局。

总的来说,综指在142131EMA动态支持线获得扶持而反弹,有形成较高底的可能。若综指形能成较高底的话,届时综指的涨势将有望维持下去,后市继续看俏。以技术而言,只要综指能维持在142131EMA以上,那综指的技术展望将处于正面。

FBM KLCI 30 July 2012
On Monday, the KLCI rebounded 7.41 points or 0.46% to close at 1632.35 points, after finding its support from the 14, 21, 31 EMA dynamic support. Although the KLCI has not yet returned to above the L2 line, with the KLCI being supported by the 14, 21, 31 EMA, the KLCI is basically still in its uptrend.
Resistance for the KLCI is at 1647.94 points.

As indicated by B, total market volume increased 25.58%, with volume above the 40-day Volume Moving Average. This generally suggests that the market is actively participated, and if volume could sustain above the 40-day Volume Moving Average, it would help sustain the KLCI or the market overal uptrend.

As indicated by C, the Stochastic breaks above 30%, leaving the short-term bearish territory as the KLCI rebound. Currently, the Stochastic is showing a neutral signal. If the Stochastic could break above 70%, it would be a short-term bullish signal for the KLCI.

In conclusion, with the KLCI rebounding from the 14, 21, 31 EMA, there is a chance for the KLCI forming higher-lows, if so, it means that the KLCI is likely to extending its uptrend movement. Technically, provided that the KLCI could stay above the 14, 21, 31 EMA, the technical outlook for the KLCI remains positive.

HAPPY TRENDING


Saturday, July 28, 2012

FKLI >>> Strategic Battle At The Daily SMA 20,25,30; Weekly Chart Steady

Bears Launch Assault With 6 Daily Lows
Weekly Down 23.5 points, Bulls Poised For Counter-attack
To further ENLARGE images >>> right click mouse click "OPEN IN NEW TAB"
FKLI Weekly Chart shows some profit takings or consolidation at the beginning of Ramadan.
This is no exception other than the norm.
No major weakness alert noted in Weekly Chart

HAPPY TRENDING


Wednesday, July 25, 2012

DJIA Technical Analysis 25 July 2012

Right click mouse "Open In New Tab" for bigger image
Bulls' Effort Too Little, Too Late as Dow Retreats 104; Index Suffers Third Straight Triple-Digit Drop
The Dow closed lower for the third day in a row and below the June-July uptrend line crossing near 12,627 amid increased speculation that Greece may miss debt reduction targets.

Additional pressure came from news that United Parcel Service Inc. lowered its profit forecast.

Today's breakout and close below the June-July uptrend line crossing near 12,627 confirms that a trend change is taking place while opening the door for sideways to lower prices into August when a seasonal low is due to be posted. Today's low-range close sets the stage for a steady to lower opening on Wednesday as the door is open for a test of the previous reaction low crossing at 12,492 possibly on Wednesday.

Closes above the 20-day moving average crossing at 12,747 would temper the near-term bearish outlook. Stochastics and the RSI are diverging and are turning bearish signaling that sideways to lower prices are possible near-term.

First resistance is the 20-day moving average crossing at 12,747.
Second resistance is last Thursday's high crossing at 12,977.
First support is today's low crossing at 12,521.
Second support is the reaction low crossing at 12,492.

HAPPY TRENDING

Tuesday, July 24, 2012

FKLI Tweezers >>> A formidable Resistance

Tweezers Proved It's Resistance Potency Last Friday
MACD 6,12,6 concurred with Dead Cross
The FBM KLCI dropped 6.83 points on Monday but the FKLI almost double that with a 13 points loss. This is due to the premium/discount factor in index futures trading albeit with a little exuberance from the bears. Given the opportunity, the bears may further aggrevate the selling by pressuring the FKLI into deeper discount.
Buyers >>> buckle your safety belt :P

HAPPY TRENDING

Friday, July 20, 2012

Technical Analysis : FBMKLCI 20/07/2012 / 富时大马综合指数 2012-07-20

FBM KLCI 20 July 2012
Despite having its daily high reaching 1647 points, the KLCI ended lower on Friday, closing at 1643 points, losing 1.6 points. The KLCI is likely to consolidate with the 1647 as the immediate resistance. Meanwhile, as indicated by A, the 14, 21, 31 EMA is still serving as the dynamic support to the KLCI while the L2 uptrend line remains intact.

As indicated by B, total market volume increased 9.98%, with volume above the 40-day Volume Moving Average. However, together with the score board showing losers outnumbering gainers, the higher volume suggests profit taking was relatively active on Friday. Fortunately, losers were only marginally higher than gainers, with 410 losers vs 376 gainers.

As circled at C, the Stochastic remains above 70%, in the short-term bullish territory. This suggests that the KLCI short-term movement is still positive, and not showing any weakening signals yet.

In conclusion, the KLCI is at consolidation mood, but the uptrend remains intact. As long as the KLCI could stay above the 14, 21, 31 EMA and the L2 line, the technical outlook for the KLCI is still positive.

富时大马综合指数 2012-07-20
尽管富时大马综合指数周五一度上探1647.41点的全日最高,但是最终仍然收低,以1643点挂收,按日微跌1.60。综指继续有盘整的迹象。综指阻力依然落在1647点。图中箭头A所示的142131EMA依然是综指的动态支持线而L2的上升趋势线也还是完整的。

如图中箭头B所示,马股总成交量周五增加了9.98%,配合马股周五下跌的股项超过上升股,因此这成交量的增加,表示套利活动也活跃起来。无论如何,若接下来综指还是维持在盘整格局的话,成交量若能减少的话才算是最理想的盘整格局。

如图中C圈所示,随机指标(Stochastic)虽然稍微下滑,但是始终维持在70%水平以上。这表示综指短期的走势还是处于强势中,暂时未有任何转弱的讯号。

总的来说,综指继续在窄幅中波动,有处于盘整格局的迹象。但是综指涨势依然是完整的。以技术而言,只要综指还是能获得142131EMAL2上升趋势线扶持的话,那综指的技术展望也还是处于正面的。

祝你好运

Tuesday, July 10, 2012

HLCAP (5274) >>> A Different Proposition Now @12.30pm 10 July 2012

The SMA 200
A Division Of Bulls & Bears
HAPPY TRADING CBK :)

20 x Lower Bollinger Band Stocks 4ur Perusal 10 July 2012

*Note: As for the top 20 breakdown list below, the sole sorting criteria is stock price must close significantly BELOW the lower Bollinger Band, with the largest distance from the lower band at the top of the table, signaling a severe sell-off which is bearish.

Caveat: A stock should bottom out if share price moves ABOVE the falling lower Bollinger Band, which can be a good buy signal for technical rebound upside after the sharp sell-off.

DISCLAIMER

The information contained herein was obtained from sources believed to be reliable. However, we do not guarantee the accuracy and completeness of the report. Opinions expressed herein are subject to change without notice. This report is for information purposes only and should not be construed as an invitation, offer or solicitation to purchase or sell any futures product referred to herein. The Author may from time to time has an interest or position in the futures products or stocks mentioned. There is a risk of loss in trading stocks,futures & derivatives like products.
 
HAPPY TRADING

Saturday, July 7, 2012

BURSA MALAYSIA ENDS WEEK WITH A BANG

FBM KLCI climbs to historic high 07 July 2012
The FTSE Bursa Malaysia Kuala Lumpur Composite Index (FBM KLCI) moved broadly higher over the week, hitting its intra-week high of 1,620.35 yesterday. The index recorded an intra-week low of 1,599.67 on Monday before rebounding to its all-time historical high of 1,620.55 yesterday, giving a trading range of 20.88 points.
Of the FBM KLCI's 30 index-linked components, gainers overwhelmed losers by 25 to five. 

ACE Market and lower-priced counters on the Main Market rose in tandem with other Main Market counters. The FBM Small Cap Index and the FBM ACE Market Index's week-on-week gains of 2.37 and 1.02 per cent, respectively, reflected the sectors' outperformance.

The FBM KLCI closed at its all-time high of 1,620.55 yesterday, posting a week-on-week gain of 21.40 points, or 1.34 per cent.

The following are the readings of some of its technical indicators :

Moving Averages: The FBM KLCI continued above its 10-, 20-, 30-, 50-, 100- and 200-day moving averages yesterday 

Momentum Index: Its short-term momentum index continued to stay above the support of its neutral reference line.

On Balance Volume: Its short-term OBV trend continued to stay above the support of its 10-day exponential moving averages.

Relative Strength Index: Its 14-day RSI stood at the 68.53 level.

FBM KLCI Technical Outlook
The FBM KLCI hit its intra-week low of 1,599.67 on Monday, staying way above the confines of this column's envisaged resistance zone (1,560 to 1,594 levels). 

Subsequent technical rebounds sent the index to its intra-week high of 1,620.55 yesterday, moving into the confines of this column's envisaged support zone (1,603 to 1,637 levels).

AirAsia, UMW, KLK and Genting's week-on-week gains of 6.72, 6.13, 4.62 and 4.45 per cent, respectively, accounted for the bulk of the FBM KLCI's week-on-week gain of 21.40 points, or 1.34 per cent. UMW replaced YTL as the week's top performer with a year-to-date gain of RM2.60, or 36.67 per cent.

The FBM KLCI's weekly chart continued to stay above its intermediate-term support (see weekly chart: A1:A2) during the week. It continued to stay decisively above its intermediate-term uptrend (A3:A4).

Chart-wise, the FBM KLCI's daily price chart continued to stay above its intermediate-term uptrend (see daily chart: B3:B4) yesterday. Also, it continued to stay above its intermediate-term uptrend support (B1:B2). Its daily and weekly fast MACDs (Moving Average Convergence Divergence indicators) continued to stay above their respective slow MACDs. However, its monthly fast MACD continued to stay below the support of its monthly fast MACD. 

The 14-day RSI stayed at the 68.53 per cent level yesterday. Its 14-week and 14-month RSI stayed at 63.15 and 65.12 per cent levels last Friday. 

Next week, the FBM KLCI is likely to re-write its all-time high, with heavyweight index-linked counters expected to continue providing the momentum thrust. The index's envisaged resistance zone is at the 1,624 to 1,658 levels, while its immediate downside support is at the 1,582 to 1,616 levels.

HAPPY TRADING

Friday, July 6, 2012

Random Stock Picks >>> GENTING / RHB Capital 06 July 2012

Technical comments : Genting Bhd is poised for breakout above the upper Bollinger band (RM9.73) which should lift share price up to RM9.85 (50%FR), RM10.19 (38.2%FR) and even RM10.62 (23.6%FR) in the longer term. Good support is seen at RM9.50 (61.8%FR), reinforced by the lower band (RM9.33).
 To further ENLARGE images >>> right click on mouse >>> "Open In New Tab"
Technical Comments : RHB Capital staged a bullish breakout above its upper Bollinger band yesterday, which will boost upside potential to target RMRM8.01 (38.2%FR), RM8.46 (50%FR) and RM8.92 (61.8%FR) going forward. Immediate support will come from RM7.44 (23.6%FR).

HAPPY TRADING

Thursday, July 5, 2012

DJIA >>> The Daily/60 Mins Technical Charts Outlook

CHARTING THE DOW BULL/BEAR
The 3 Ts >>> Technical Testing Times
As illustrated in the daily chart, the blue-chip benchmark is challenging resistance at the June peak, an area followed by additional overhead around the 13,000 mark.

(Dow 13,000 approximates the February closing peak, and the March breakout point.)
The specific levels hold at each benchmark’s June peak, and these areas mark the near-term bull/bear battleground. The charts above add colors.
Meanwhile, the Dow industrials’ near-term backdrop is slightly weaker. In its case, the blue-chip benchmark remains capped by the June peak of 12,899. On further strength, additional resistance holds around the 13,000 mark, better illustrated on the daily chart.
Technical Analysis : Dow Industrial Average 05 July 2012 The Dow closed higher on Tuesday renewing the rally off June's low. The high-range close sets the stage for a steady to higher opening on Thursday. Stochastics and the RSI are bullish signaling that sideways to higher prices are possible near-term. If the Dow extends the aforementioned rally, May's high crossing at 13,338 is the next upside target. Closes below last Thursday's low crossing at 12,450 would confirm that a short-term top has been posted.
First resistance is today's high crossing at 12,946.
Second resistance is May's high crossing at 13,338.
First support is last Thursday's low crossing at 12,450.
Second support is the reaction low crossing at 12,398.

HAPPY TRADING

Wednesday, July 4, 2012

Technical Analysis : FBMKLCI 03/07/2012 / 富时大马综合指数 2012-07-03

FBM KLCI 03 July 2012
As indicated by A, the KLCI gained 6.89 points or 0.43%, to close at 1607.74 points, which is the historical high in closing. The L2 uptrend remains intact, while the 14, 21, 31 EMA is still serving as the dynamic support to the KLCI uptrend.

As indicated by B, total market volume gained 16.2%, with volume above the 40-day Volume Moving Average. Generally, with volume above the 40-day Volume Moving Average, it is a signal suggesting that the overall market participation is relatively active. However, if the KLCI should continue rising, and breaks above its historical high of 1611, more volume is needed to confirm such bullish break out.

As indicated by C, the MACD histogram is still falling but at a noticeably slower pace. If the MACD histogram should tick up and form a Rounding Bottom, it suggests that the KLCI short-term is picking up some strength again.

In conclusion, with the KLCI continues supported by the 14, 21, 31 EMA dynamic support as well as the L2 uptrend line, the technical outlook for the KLCI is still positive. If the KLCI could break above 1611, it would allow more upside room for the KLCI, but to sustain this uptrend, the KLCI would have to repeatedly forming higher-lows.

富时大马综合指数 2012-07-03
如图中箭头A所示,富时大马综合指数周二上扬6.89点或0.43%,以1607.74点挂收。虽然综指全日未创下新高,但是1607.74点也是马股有史以来最高的收市水平。图中所示L2线继续是综指目前上升趋势线,同时142131EMA也继续为动态支持线。

如图中箭头B所示,马股总成交量周二增加了16.2%,目前还是维持在40天的成交量平均线(VMA)的水平以上。这表示马股当前的交投还算是回到活跃的状况。不过,若综指接下来继续走高,并上扬突破1611点的阻力水平,同时也配合成交量明显增加的话,届时将有助于确认综指突破阻力的强势讯号。

如图中箭头C所示,平均乖离振荡指标(MACD Histogram)虽然还是在下滑中,但是下滑的速度在周二明显的减退下来,因此有望形成圆底(Rounding Bottom)。以技术而言,若平均乖离振荡指标开始上升而形成圆低的话,那表示综指短期走势有转强的讯号。

总的来说,综指因继续获得142131EMA动态支持线的扶持,同时也维持在L2上升趋势线以上,因此综指的技术展望还是处于正面。接下来若综指能上扬突破1611点的历史高峰,那将为综指后市带来更大的上扬空间。不过,综指突破阻力后仍然需要重复的形成较高底(Higher-Lows)的涨势特征,那涨势才能维持下去。

祝你好运

Tuesday, July 3, 2012

30 x Middle Bollinger Band Stocks 4ur Perusal 03 July 2012

*Note: To qualify in this list below, the first sorting criteria is stock price must have just climbed or stayed ABOVE the middle Bollinger Band, followed by a second criteria that trading volume for the day must be significantly strong. This is a good watch list for momentum traders looking for short-term BUY ideas, as they are laggards with good upside potential towards the upper Bollinger band or higher to TAKE PROFIT/SELL.

Caveat: Some stocks may continue to stay rangebound and trade sideways, hence traders should refer to their respective charts to spot accumulation (volume growth) or breakout patterns.

DISCLAIMER

The information contained herein was obtained from sources believed to be reliable. However, we do not guarantee the accuracy and completeness of the report. Opinions expressed herein are subject to change without notice. This report is for information purposes only and should not be construed as an invitation, offer or solicitation to purchase or sell any futures product referred to herein. The Author may from time to time has an interest or position in the futures products or stocks mentioned. There is a risk of loss in trading stocks,futures & derivatives like products.
 
GOODLUCK